01.10.2024
Optimizing sensor placement to guarantee site coverage and inform analytics: how Nubo Sphere turns raw data into actionable insights, part two
Nubo Sphere measures unintended, fugitive methane emissions at oil and gas sites using a combination of purpose-built sensor technology, an informed siting procedure and advanced analytics. In part one of this series we looked at how the photoacoustic-based laser spectroscopy Nubo Sphere methane sensor provides the most accurate raw data on methane concentrations in air. In this article, we look at the Nubo Sphere siting procedure.
- Technology Insights
- Oil & Gas
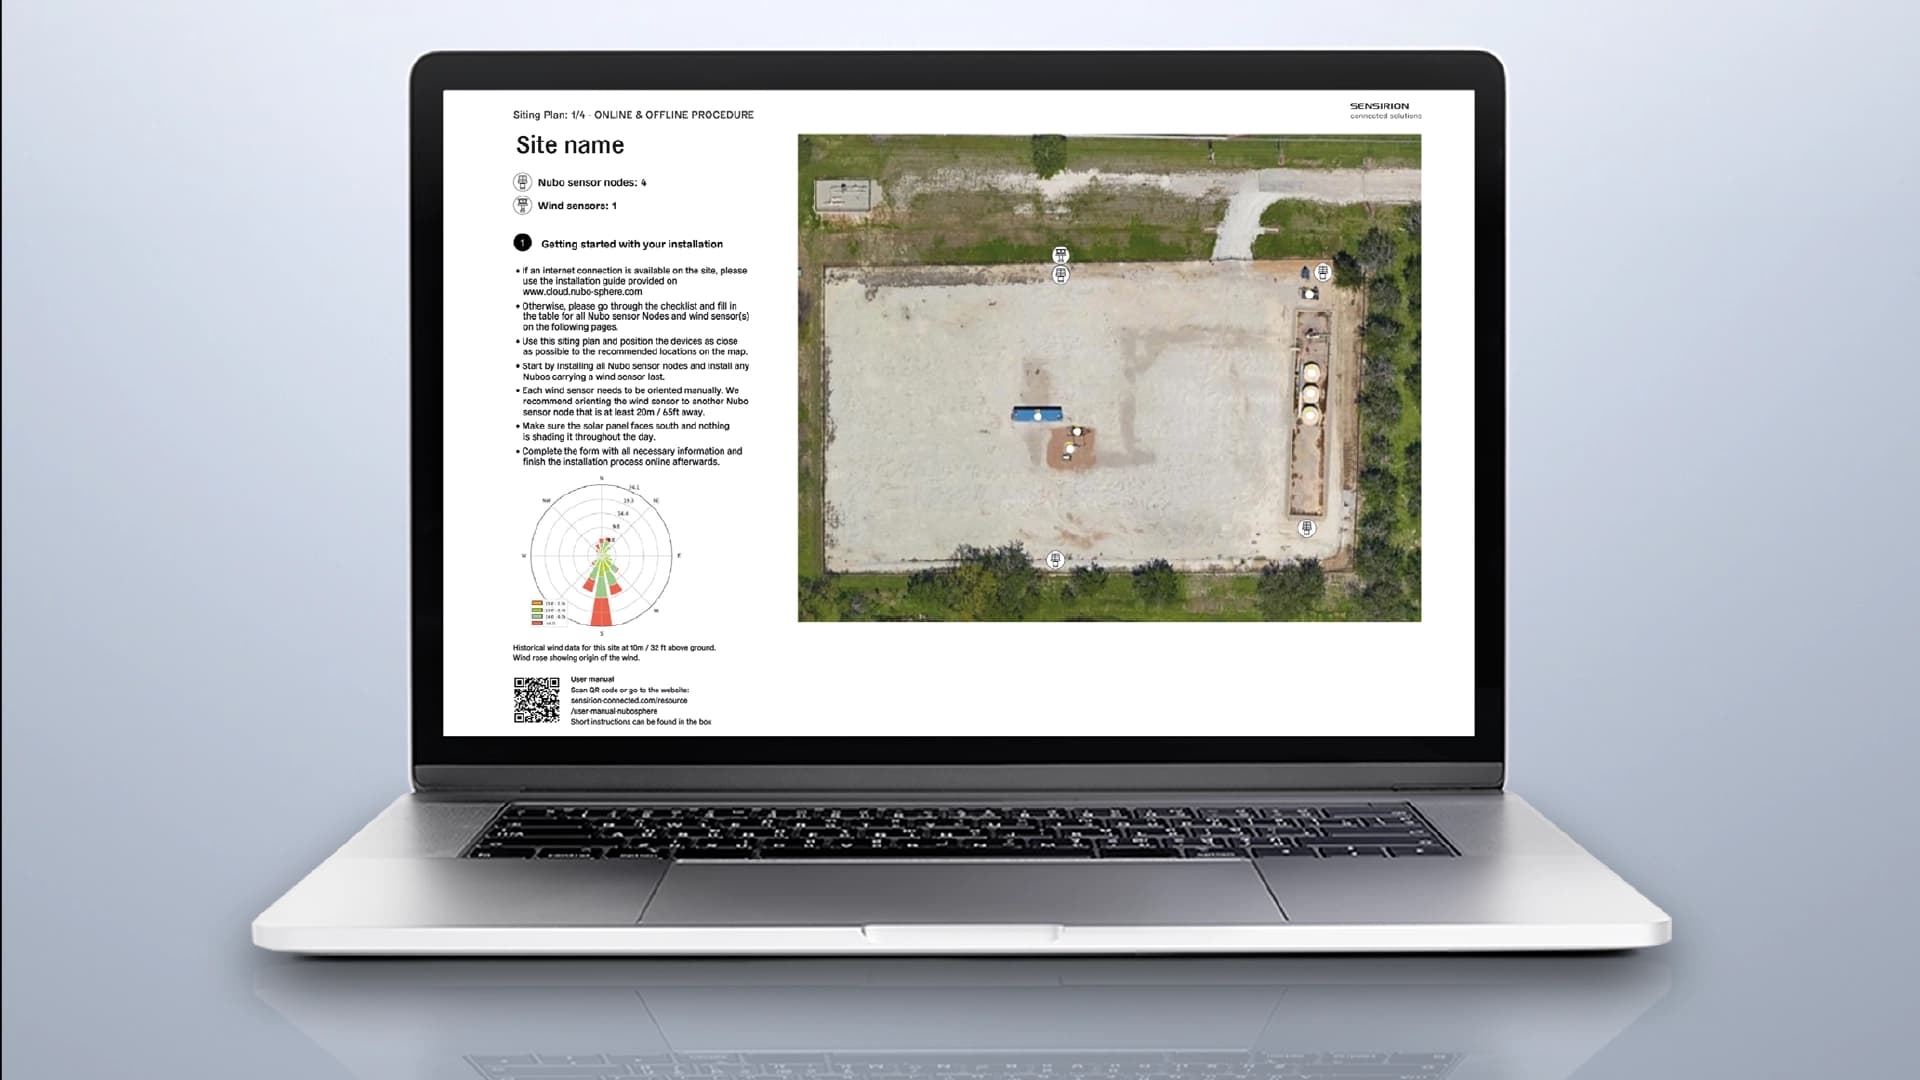
Table of contents
- Executive summary
- Why siting is important for optimal sensor performance and informed analytics
- Gathering information—what information does siting need?
- Optimizing sensor placement, delivering the siting proposal
- Feeding analytics—beyond raw sensor data
- Conclusion: comprehensive siting yields comprehensive coverage
Executive summary
Nubo Sphere measures unintended, fugitive methane emissions at oil and gas sites using a combination of purpose-built sensor technology, an informed siting procedure and advanced analytics. In part one of this series (available here) we looked at how the photoacoustic-based laser spectroscopy Nubo Sphere methane sensor provides the most accurate raw data on methane concentrations in air. In this article, we look at the Nubo Sphere siting procedure.
Siting plays two roles in effective emissions monitoring. First, it optimizes sensor placement, guaranteeing site coverage and maximizing the probability of detecting emissions while ensuring regulatory compliance and maintaining cost efficiency. Second, it’s a source of additional data, such as historical wind information and the height and location of equipment, that Nubo Sphere analytics use to form a complete picture of methane emissions.
This article explores in depth what information the Nubo Sphere siting procedure uses, and how this ensures comprehensive coverage of emissions sources and supports advanced analytics in the localization and quantification of methane emissions. This includes key insights into what oil and gas operators can expect when using Nubo Sphere. Read on to discover how many sensor nodes sites typically require, where sensors are best deployed and how the Nubo Sphere siting procedure uses wind data to guarantee site coverage.
If you would like to download the article as a printable PDF, please click here: Download
Why siting is important for optimal sensor performance and informed analytics
Nubo Sphere detects methane emissions using fixed-point sensor networks placed on oil and gas sites. As the first article in this series illustrated, when one of Nubo Sphere’s photoacoustic-based laser spectroscopy sensors encounters methane travelling on the wind, it quickly and accurately measures the local methane concentration. The siting procedure optimizes sensor placement to guarantee these encounters as soon as possible after the start of a methane emission.
Siting is also critical to providing the balance of information Nubo Sphere’s analytics use to quantify and localize emissions. From the locations and heights of potential emissions sources to the strategic placement of wind sensors that provide vital complementary information, siting is the framing atop the solid foundation of good sensor information around which Nubo Sphere builds a complete model of methane emissions.
Javier Bilbao, Product Manager at Sensirion Connected Solutions, explains: “The smart placement of fixed-point sensors at oil and gas sites is critical to reliable monitoring of methane emissions, ensuring that sensor nodes are placed in optimal proximity to potential leak sources to accurately detect, localize and quantify these emissions. This strategic siting improves the accuracy of analytics and the effectiveness of mitigation strategies. Based on the past two years of operations in the field, we’ve fine-tuned this siting procedure to achieve EPA approval of Nubo Sphere as a continuous monitoring and periodic screening solution.”
What locations can Nubo Sphere monitor?
Nubo Sphere is a continuous monitoring solution for oil and gas sites, including production, processing and transmission facilities. It’s designed to work in conditions typical of those sites; the siting procedure takes account of these conditions to optimize sensor placement. There are, therefore, certain universal site requirements when deploying Nubo Sphere.
The solution requires an unobstructed view of the sky to use information from a Global Navigation Satellite System (GNSS). Acquiring this information is impossible if Nubo Sphere can’t communicate with satellites. A view of the sky is also necessary for Nubo Sphere’s power system. Its sensor nodes are powered by solar panels in combination with internal rechargeable batteries.
Nubo Sphere also connects to cloud-based analytics. All sites, therefore, require LTE or 2G cellular coverage. Finally, it’s not possible to install Nubo Sphere sensor nodes in hazardous zones.
Gathering information—what information does siting need?
Siting is primarily about meeting customers’ monitoring needs and helping them meet their goals. The procedure builds on customer-specific requirements, gathering information on equipment locations, exclusion zones and historical wind data to deliver cost-efficient and reliable monitoring.
This section walks through the information gathering process, illustrating how each part informs the whole.
Customer needs
When creating a siting plan, customer needs come first. Different sites present different challenges—compressor stations, for example, often have elevated baseline levels of methane. And different challenges call for different approaches.
Customers may have specific emissions monitoring goals based on ESG commitments or regulations in their area of operation. Certain equipment may need more coverage. Monitoring for super emitters might be a priority. Conversely, on sites that are unlikely to produce large emission rates, time to detection may be less important than minimizing costs. Minimal coverage, maximal coverage or anything in between is possible. Providing the right level depends primarily on customer needs.
Customers also choose the detection threshold they require. If they don’t want notifications for emissions below a certain threshold, the Nubo Sphere siting procedure can tailor their installation accordingly. Fewer Nubo Sphere sensor nodes are needed when only emissions above 15 kg/h are relevant, as is the case when conducting monthly screenings according to EPA guidelines. In contrast, detecting 1 kg/h emissions, the detection limit of quarterly screening according to EPA guidelines, requires more comprehensive sensor coverage.
Customers using Nubo Sphere (pending EPA approval) for periodic screening according to EPA guidelines can also choose the detection threshold and screening frequency that best suits their operations.
Equipment locations
Monitoring for fugitive methane emissions means monitoring potential emissions sources. Coverage of the whole site, therefore, is less important than covering all points within the site that may generate emissions.
The Nubo Sphere siting procedure maps the type and location, including height, of all equipment. This information, combined with information on wind and the operating range of Nubo Sphere sensor nodes, is key for maximizing coverage of potential leak sources across variable conditions.
Exclusion areas
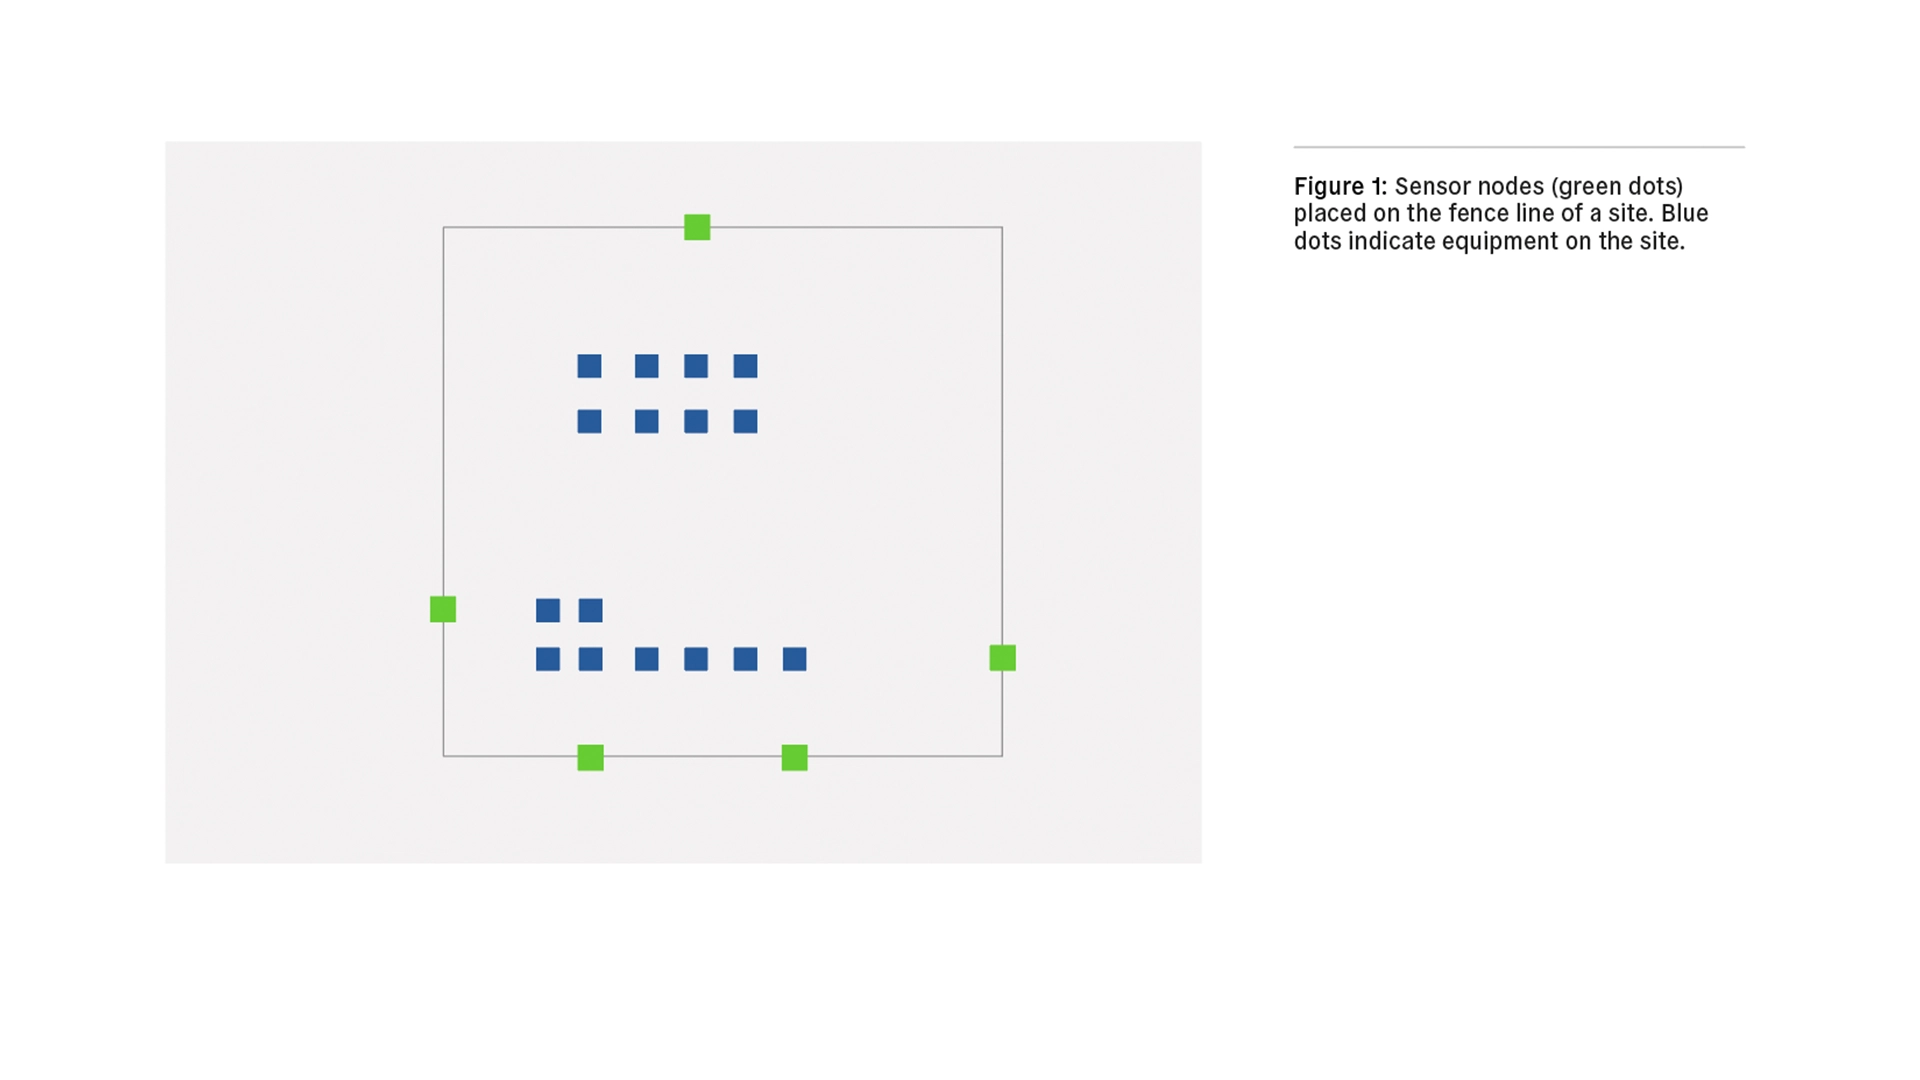
Oil and gas sites are work sites. Nubo Sphere sensor nodes are best placed out of the way of trucks and equipment, and outside of hazardous zones. Javier Bilbao says this has a fundamental influence on sensor placement: “The fence line is almost always where we place sensors because it's the most realistic area to place sensors without interfering with operations. It’s also the safest place where we can still deliver the best coverage.”
Sensor range and emission rates
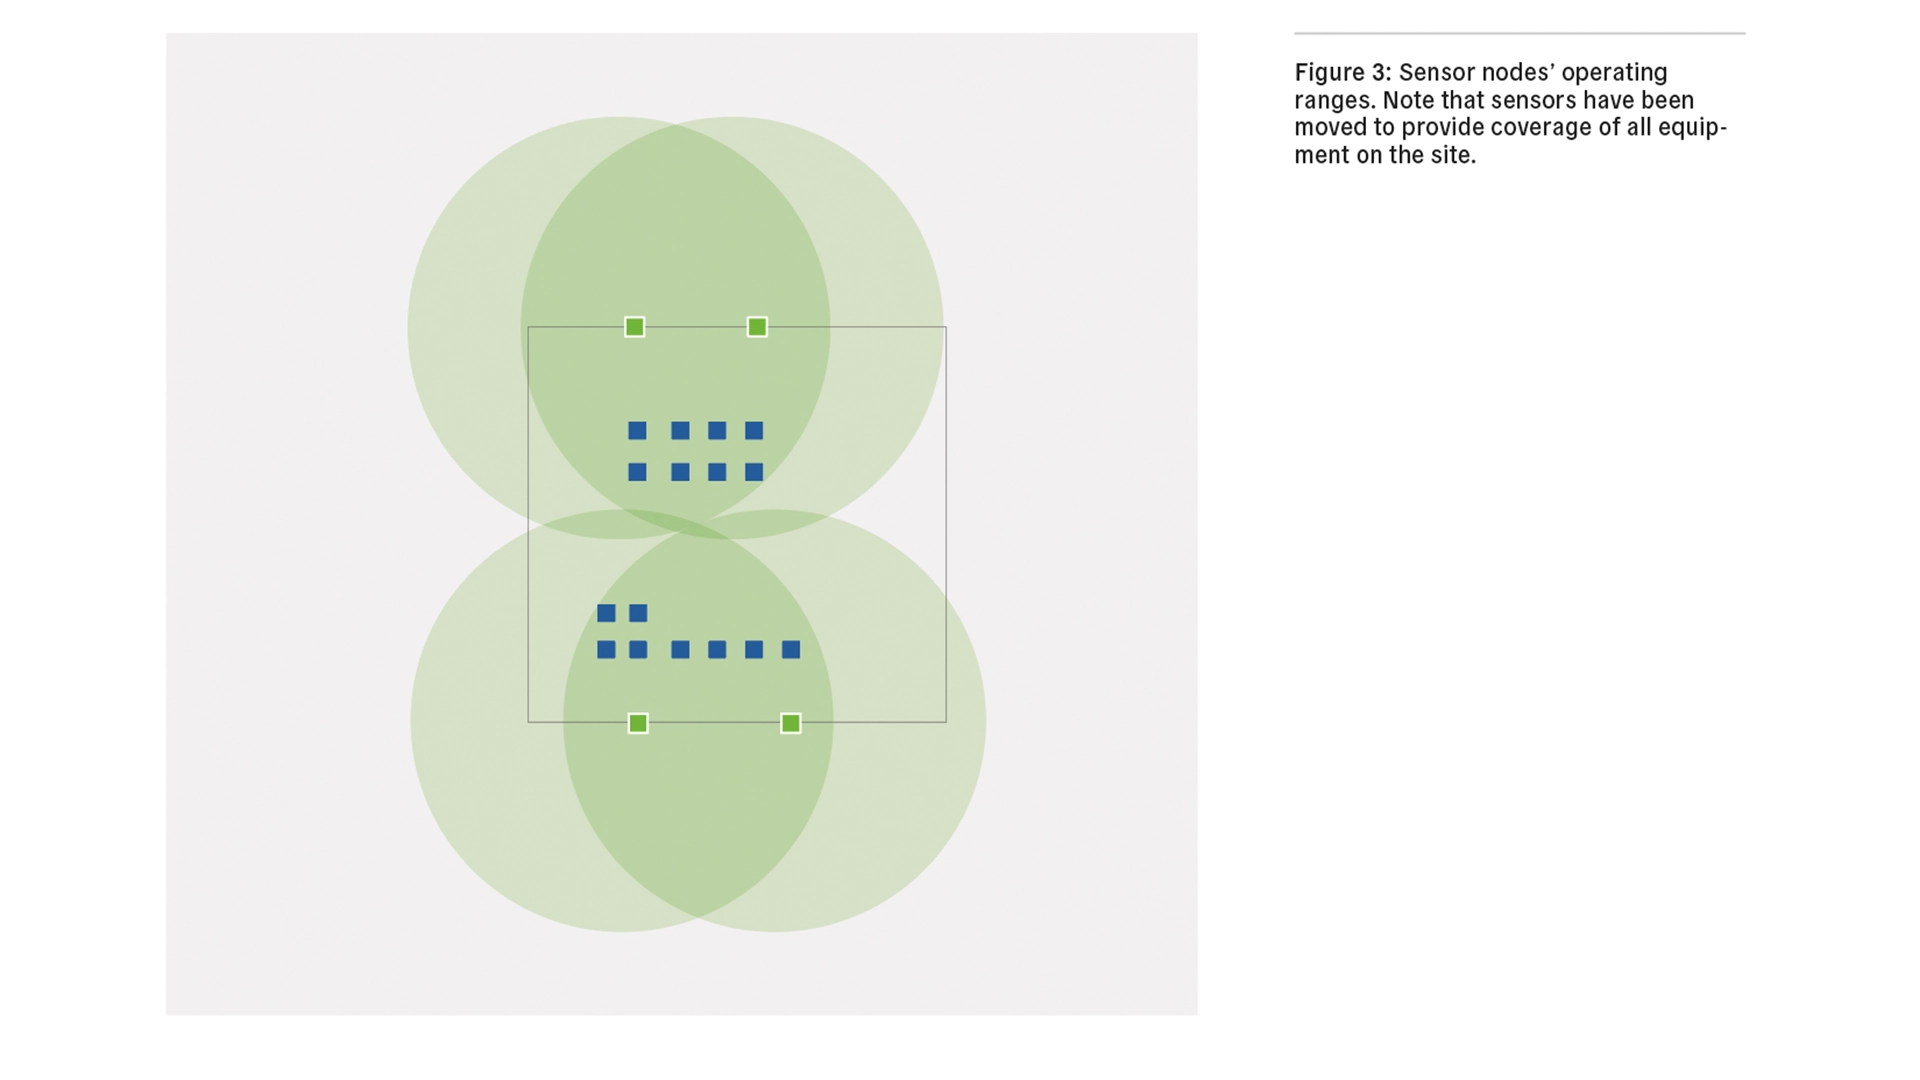
Nubo Sphere sensor nodes’ operating range depends on emission rates. For emission rates of 1 kg/h, Nubo Sphere’s sensors have an operational range of 5 – 70 meters (15 – 220 feet). Simply put, sensors can more easily detect large emissions than small emissions because larger emissions produce more methane that can reach the sensors—even at greater distances. This results in a corresponding change in sensor range, which means that, ceteris paribus, coverage improves at higher emission rates. Siting for coverage of 1 kg/h emissions is a conservative approach. It ensures complete coverage for larger emissions rates.
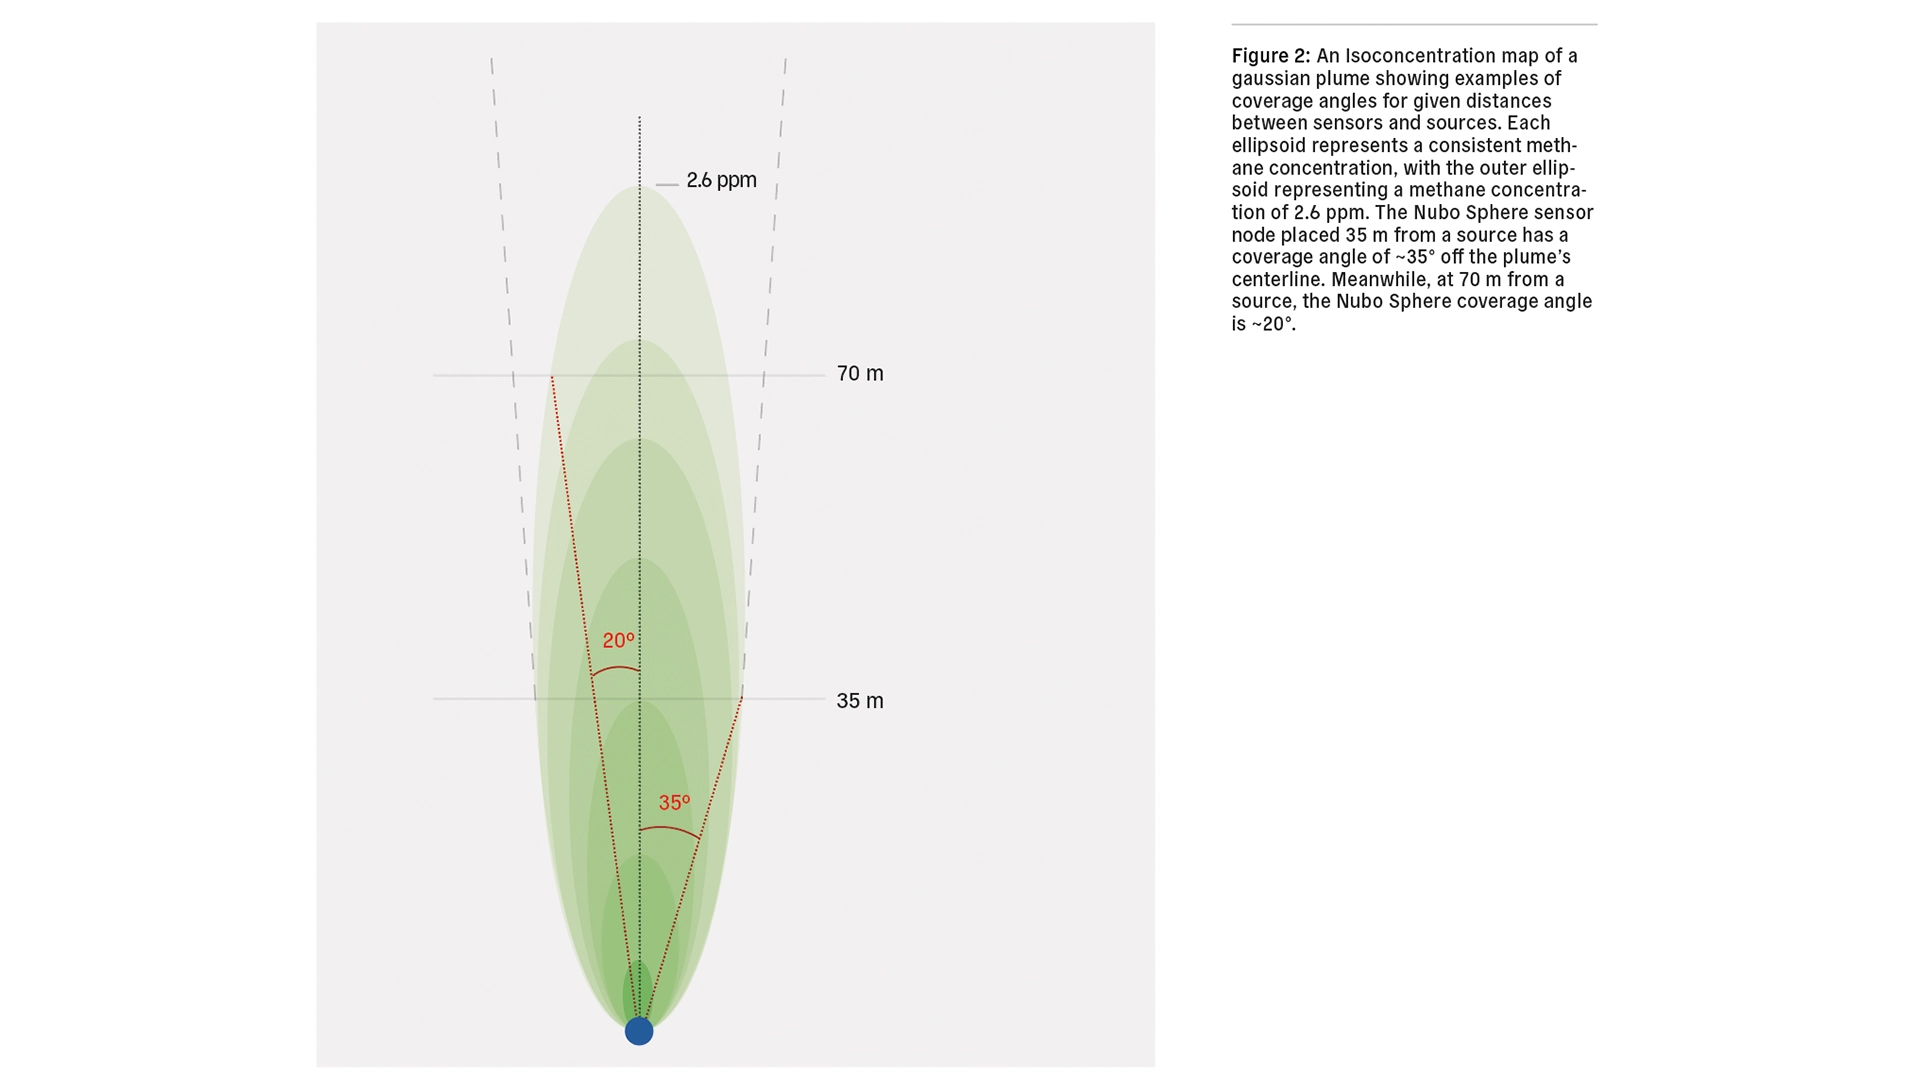
Range is fundamentally affected by how methane disperses in the air. Javier Bilbao explains: “We want our sensor nodes to be close enough to the sources that the measurable signal stays above the detection limit of the sensor. But we also don't want to be too close, because if you're too close, you don't have a plume, you have a jet.” Measuring methane emissions in ambient air, therefore, depends on understanding how methane moves on air.
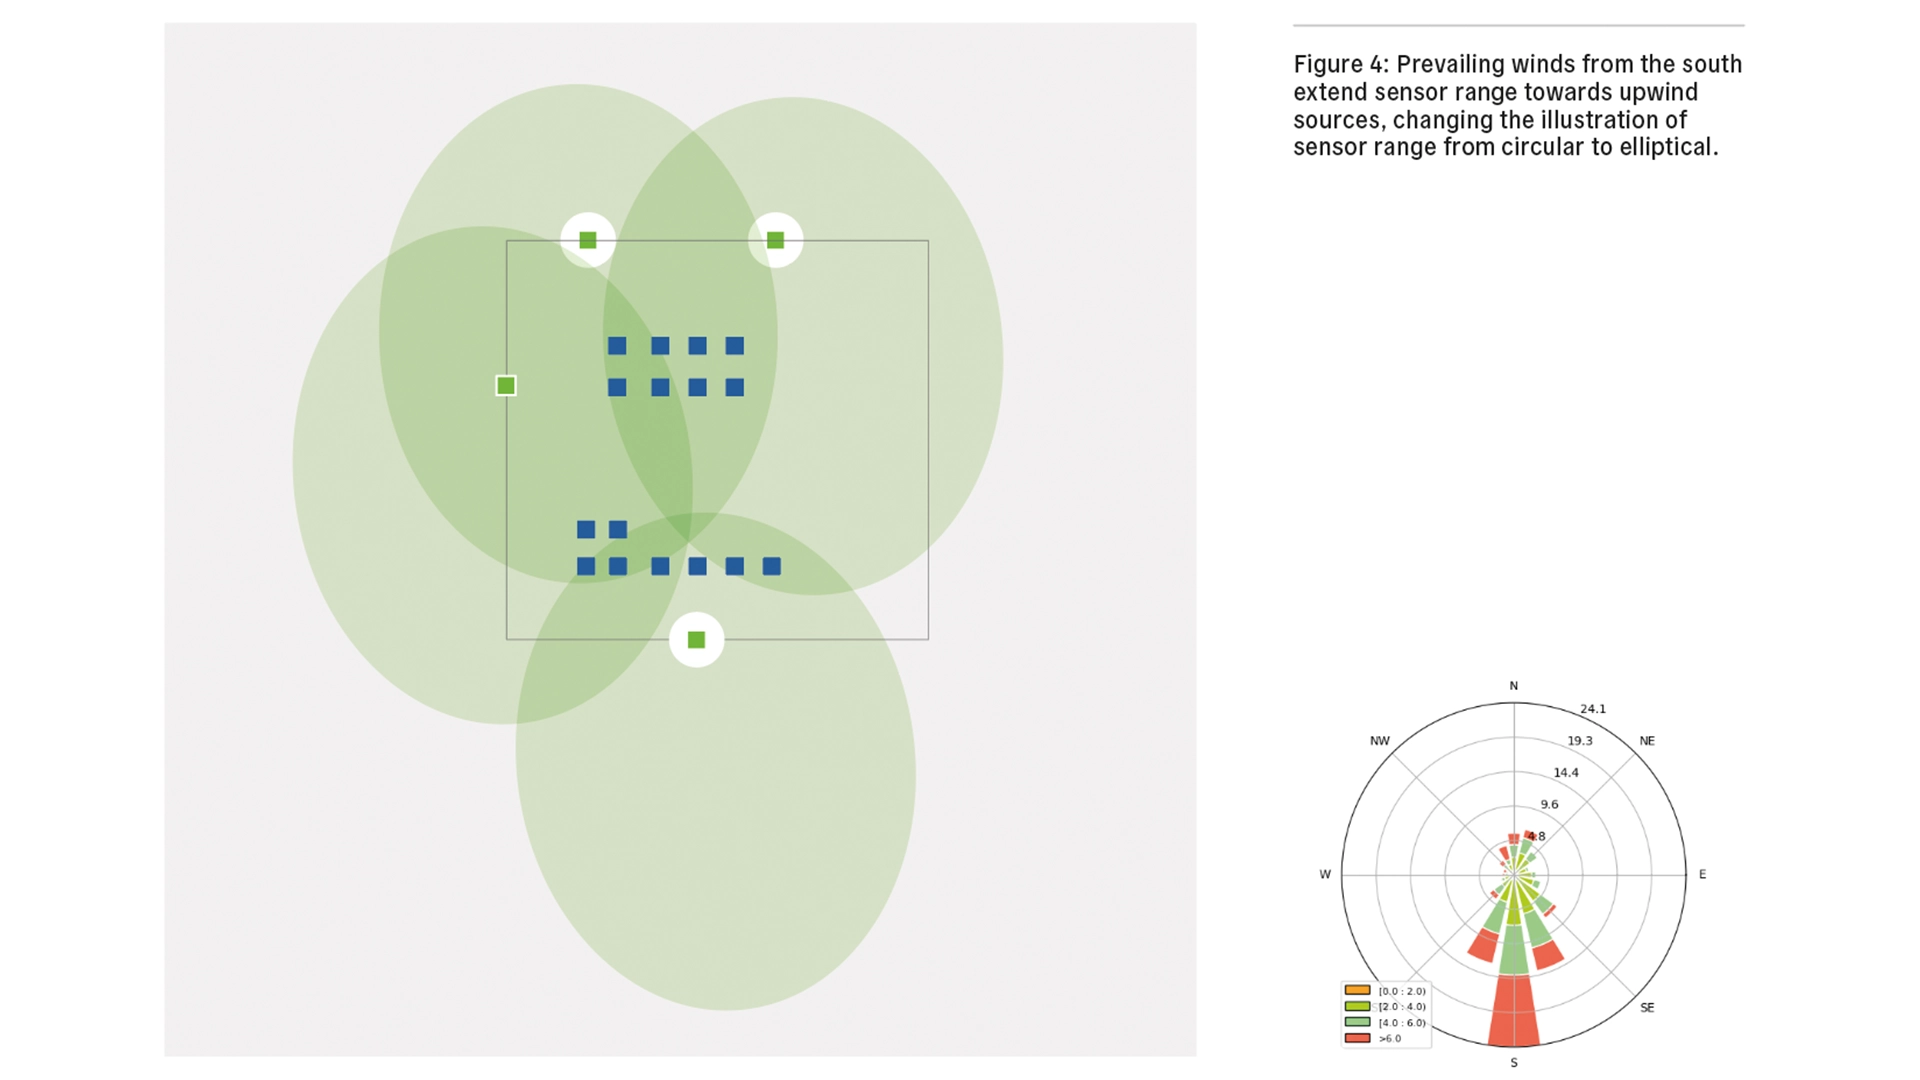
Nubo Sphere uses data on wind direction and variation of wind direction to calculate the covered angle for each Nubo Sphere sensor node. For a given wind direction and source-sensor distance, the coverage angle is given by the width of the methane plume, based on the Gaussian plume model, and the detection limit of Sensirion’s photoacoustic-based laser spectroscopy methane sensor. Nubo Sphere’s detection limit of 70 m is essentially the maximum distance at which it’s possible to get a reliable sensor signal above the methane concentration threshold of 2.6 ppm from a 1 kg/h emission while still covering a reasonable angle. It is still possible to detect methane at this concentration from 100 m, but the coverage angle is essentially a straight line between the sensor and the source. This minimizes the points in time at which that sensor can pick up a methane emission from that source.
All emission sources that customers wish to be monitored must fall within the operational range of at least one sensor node. Coverage by more than one sensor node is ideal, providing reliability and improving redundancy across a broader range of wind conditions and additional perspective for Nubo Sphere analytics.
Wind information
The Nubo Sphere siting procedure generates a wind rose using publicly available, historical wind data on predominant wind directions and speeds. Upon deployment, sites are also equipped with 2D ultrasonic anemometers to collect accurate, real-time wind information. Typically, sites only require one anemometer, installed above a sensor node on the same pole, clear of any obstacles, and upwind of the prevailing wind direction. Placing this sensor node clear of walls, trees, buildings or other obstacles to the wind’s motion ensures that wind reaches it undisturbed, and the sensor node can take accurate measurements. This is the most important condition in placing the wind sensor. If it’s also upwind of the prevailing wind, then that is the best option.
Wind sensors provide Nubo Sphere analytics with key information for tracking emissions back to their sources. But before that can happen, it’s necessary to complete the Nubo Sphere installation. Contextualizing prevailing wind information is critical when using it to inform sensor placement. “If you look at the distribution of wind overtime, there is a dominant wind direction,” Javier says. “But it's not like 90% of the time you have wind from this direction. We use the prevailing wind direction during siting, but we don't place all the sensors only according to the prevailing wind.”
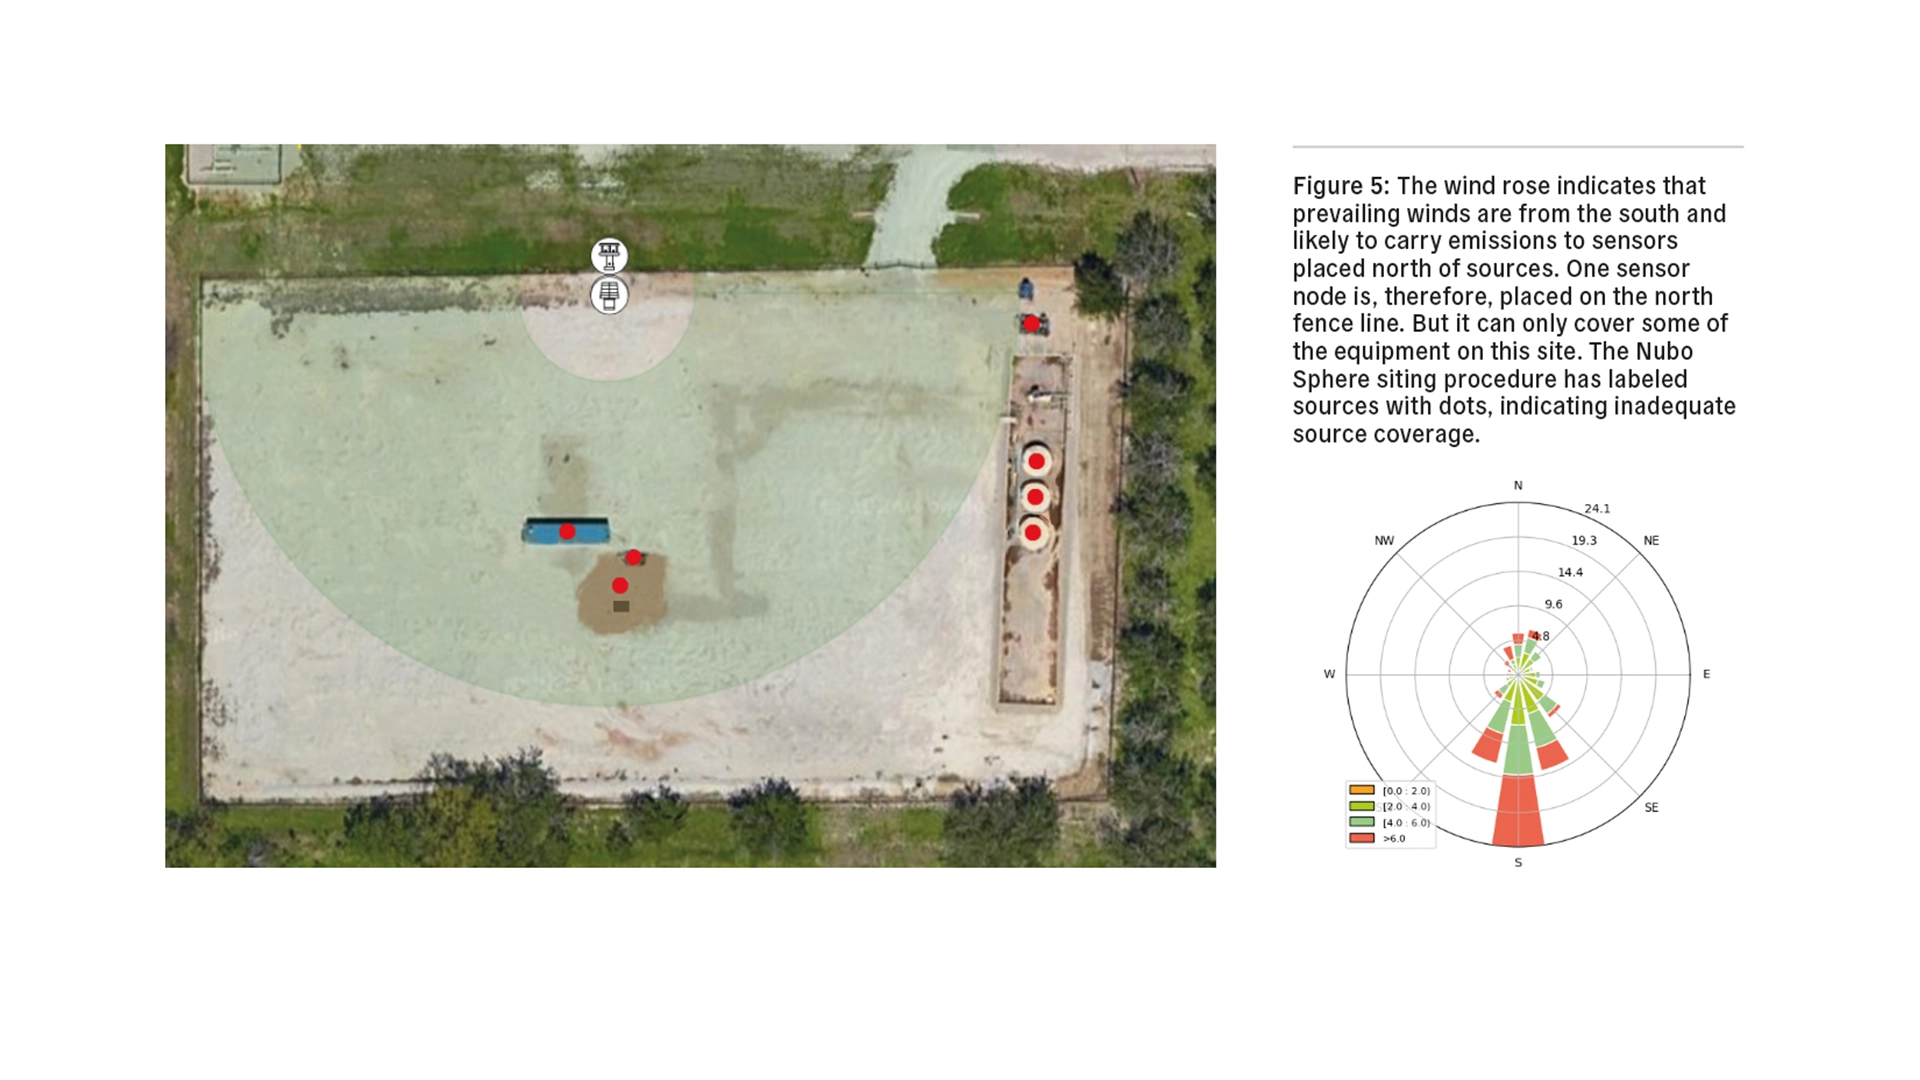
Winds change. Prevailing winds only indicate a tendency for winds to come from a certain direction. Furthermore, local wind conditions may vary from the prevailing winds due to obstacles or uneven terrain. Therefore, it’s important not to blindly trust the wind rose for siting. Placing sensor nodes around the entire site to cover all possible wind directions is still important. For example, in Texas prevailing winds during the spring and summer are from the south, influenced by the Gulf of Mexico. But during the winter, cold fronts tend to change prevailing winds 180°. Good sensor coverage north of sources is essential, but it’s also important to place a sensor node at the southern edge of the site for coverage when winds change.
Indeed, the relationship between emissions sources, sensor coverage and emissions carried on the wind is more complex than simply trusting that sensor nodes placed downwind of prevailing winds will catch more emissions than not. The next section explores how the Nubo Sphere siting procedure accounts for that complexity to maximize equipment coverage.
Optimizing sensor placement, delivering the siting proposal
With information on customer-specific needs, equipment locations, exclusion areas, sensor range and wind, Sensirion Connected Solutions has the essential information to generate a siting proposal that will meet operators’ needs for site coverage.
Siting in action
The Nubo Sphere siting procedure assigns each potential emission source two scores:
- The percentage of source coverage based on prevailing winds. For example, if the wind rose tells us the prevailing wind is from the south, placing sensor nodes north of sources will give us a better source coverage score than placing them south of sources.
- The spread of sensors around the source. For example, placing sensor nodes only north of sources produces a worse spread score than placing them in the south, east and west as well.
Good siting optimizes both parameters. The Nubo Sphere siting procedure provides visual cues for how well a source is covered according to the selected emission rate, distance of source to a Nubo Sphere sensor node, and the two parameters mentioned above:
- Red: inadequate source Coverage
- Orange: acceptable source Coverage
- White: good source coverage
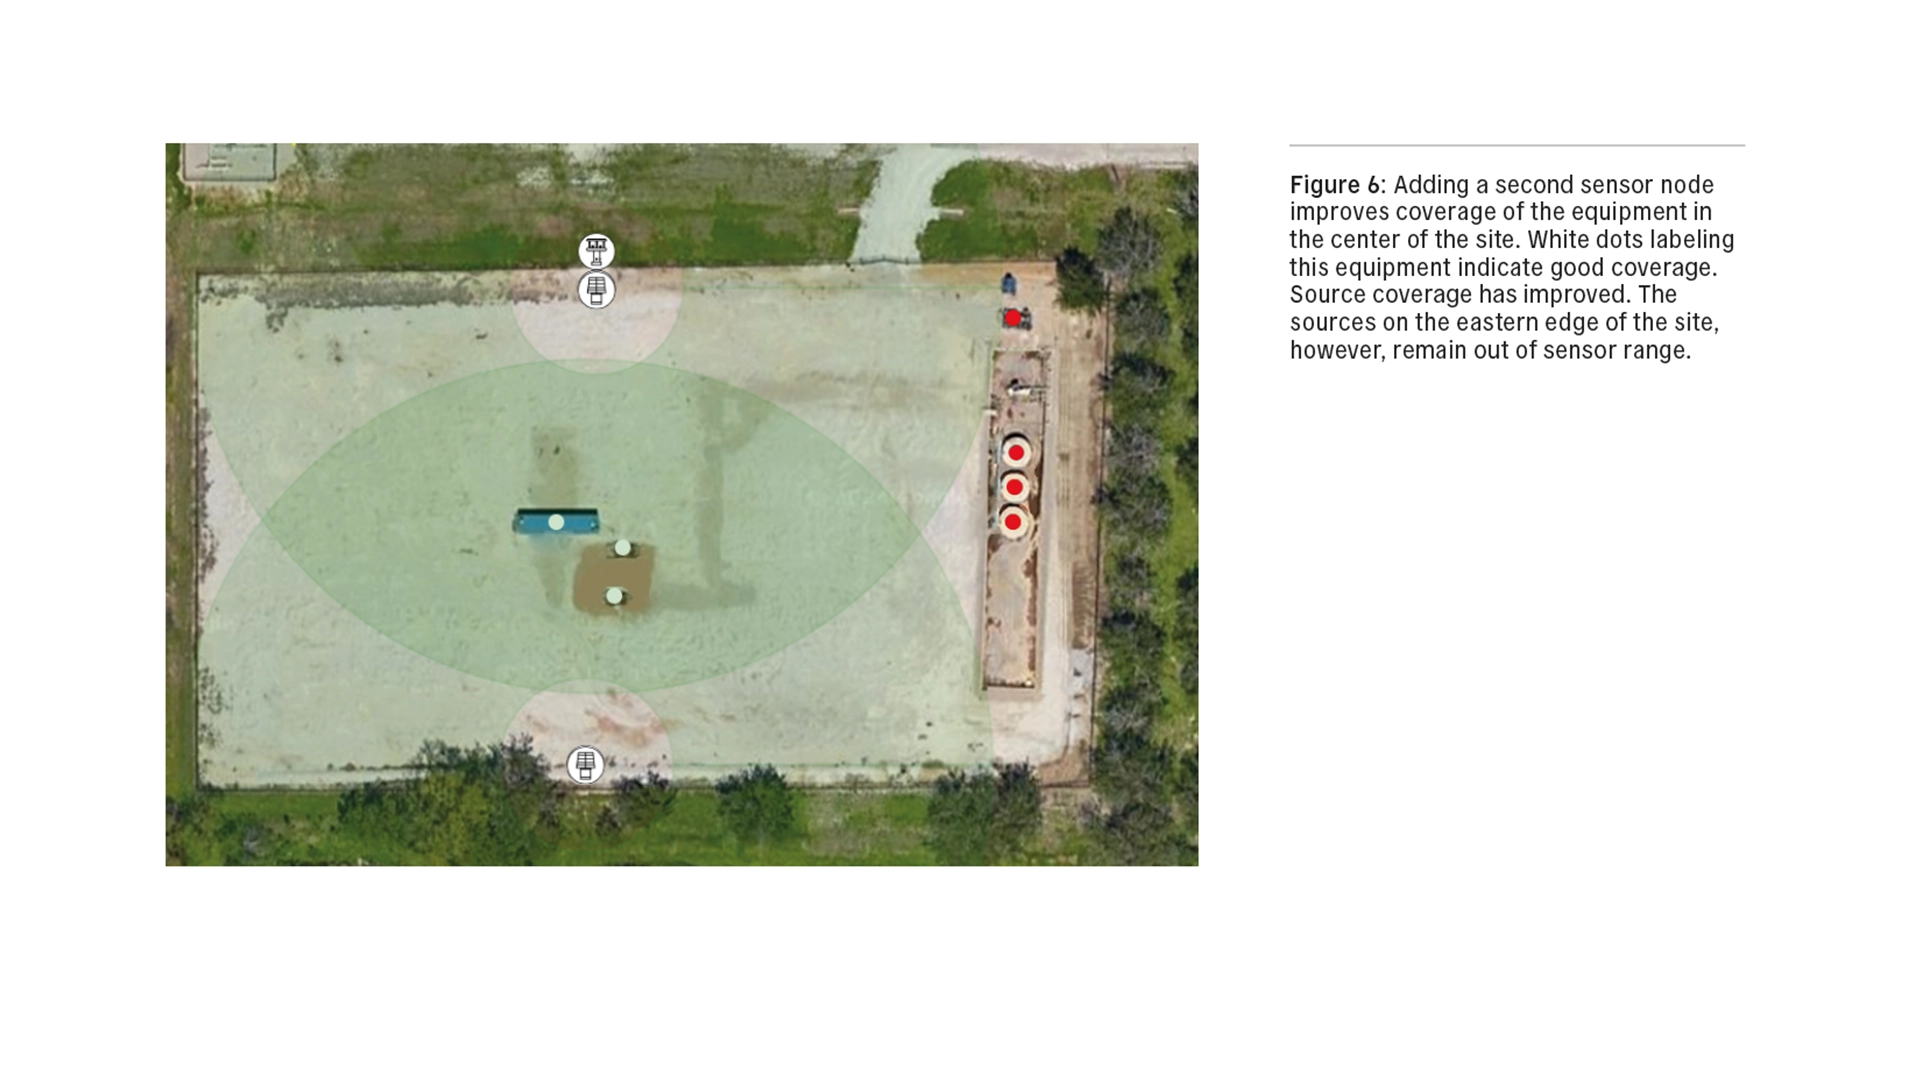
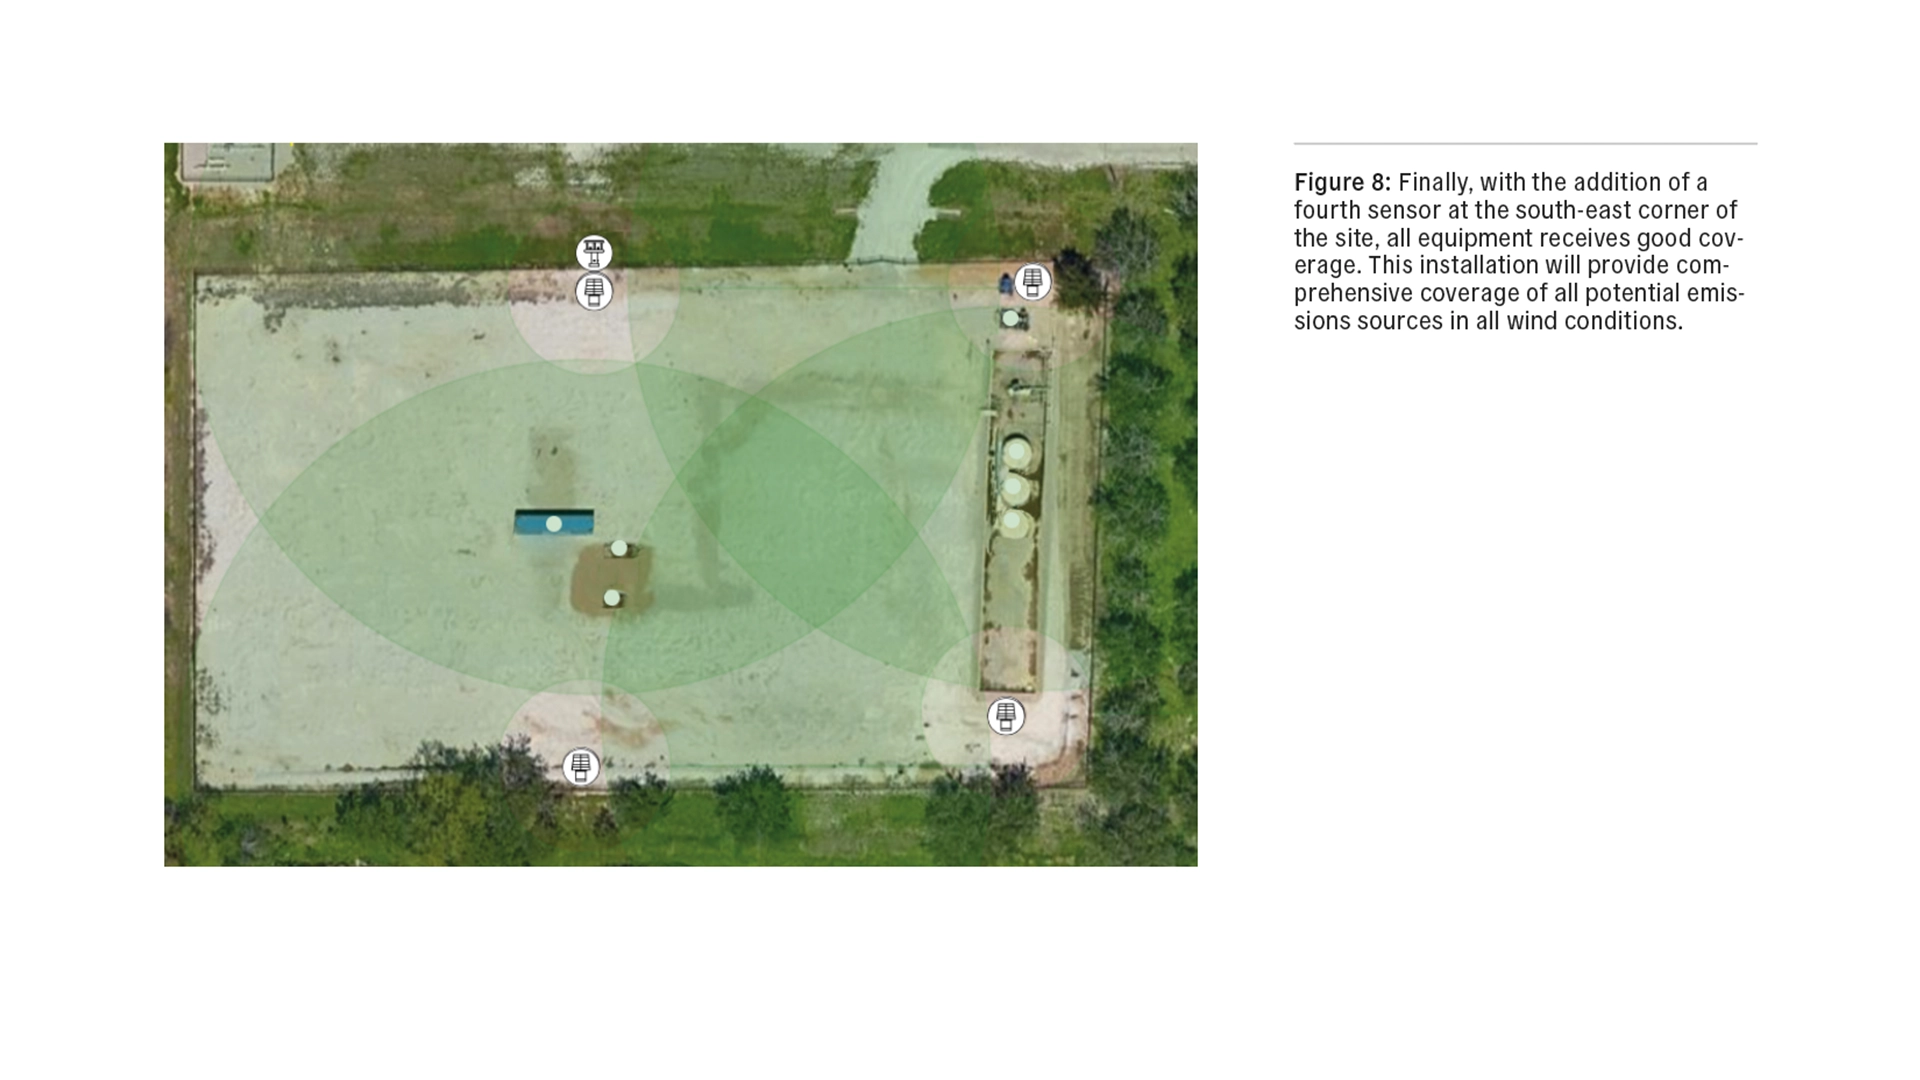
Figures 5 - 8, below, show how the calculations behind the Nubo Sphere siting procedure pay out in comprehensive coverage. As we add sensor nodes to the fence line, we see a change in color, which means better coverage and spread.

How many Nubo Sphere sensor nodes do oil and gas sites need for effective continuous methane emissions monitoring?
The number of sensor nodes required on a given site depends on customer needs and coverage. A site should have enough sensor nodes to cover all possible emission sources at a specified detection threshold. A well site with major production and processing equipment, for example, would typically require three or four sensor nodes.
Preparing for installation
Based on the information collected above, Sensirion Connected Solutions provides operators with a siting proposal. After review and approval, this proposal will guide the installation of Nubo Sphere sensor nodes, ensuring optimal sensor performance—and a wealth of information for Nubo Sphere analytics.
Feeding analytics—beyond raw sensor data
Nubo Sphere methane and wind sensors send live information to Nubo Sphere’s advanced analytics. Here, information gathered during the siting procedure complements real-time sensor data, allowing analytics to create a complete picture of emissions. Analytics benefit from more input—the more we know outright, the less work remains to fill in the blanks. And that means operators using Nubo Sphere get more accurate insights faster.
Deeper coverage yields more accurate analytics
Just like our two eyes not only broaden our field of vision but also provide depth perception, data from multiple sensors can improve the quality and accuracy of measurements. Gabriele Nunnari, Algorithm Engineer at Sensirion Connected Solutions, explains: “We use a Gaussian plume model, which can calculate the concentration at any given point assuming an emission with a given intensity at another point... If you have multiple sensors, you can find the parameters, such as emission rate or location, of the emission which satisfy both methane concentration measurements. With multiple sensors at different locations, you can shrink uncertainties even more.”
This comes back to the siting procedure. With the broad field of coverage offered by Nubo Sphere sensor nodes, it’s possible to layer coverage over equipment to achieve this effect. Depending on customer needs, it’s possible to leverage this to achieve more accurate localization and quantification.
Conclusion: comprehensive siting yields comprehensive coverage
Operators can count on Nubo Sphere to reliably provide comprehensive coverage of all potential emissions sources on oil and gas sites. The Nubo Sphere siting procedure optimizes sensor node placement to monitor for fugitive methane emissions in variable wind conditions, while also furnishing Nubo Sphere analytics with valuable information on emissions sources.
The Nubo Sphere siting procedure is a vital part of the solution. It gets the most out of the solution’s sensors—the best sensors for monitoring oil and gas sites for fugitive emissions using a fixed-point sensor network. It gives the most to the solution’s advanced analytics, providing critical information that Nubo Sphere uses to accurately localize and quantify emissions.
In the next article in this series, we look at Nubo Sphere’s analytics. This is where high-quality data from Nubo Sphere sensors combines with site-specific information and the magic really happens.

Related Insights Blog
27.06.2024
The best raw data comes from the best sensor technology: how Nubo Sphere turns raw data into actionable insights, part one
Nubo Sphere is designed from the ground up to provide a complete picture of methane emissions throughout the year and deliver actionable insights that oil and gas operators can rely on to localize and quantify emissions. This article is the first of three revealing how Nubo Sphere achieves this goal. All starts with high-fidelity raw data—a crucial input for advanced data analytics.
09.05.2025
Proactive compliance with California’s Senate Bill 1137
The California Senate Bill 1137 (SB 1137) applies to oil and gas operations located in defined health protection zones within the state. Read on to learn how this bill will affect operations, and how Nubo Sphere can help achieve ompliance—not only with respect to SB 1137 but also California’s developing methane regulations in line with the US EPA’s EG OOOOc.
19.11.2024
How to use continuous monitoring for periodic screening: why Nubo Sphere is seeking EPA approval as a periodic screening solution
This article explores the advantages of continuous monitoring when used for periodic screenings. It includes guidance on the latest EPA regulations found in NSPS OOOOb and GHGRP Subpart W with an eye to efficiently reducing emissions through periodic screenings. Operators interested in upcoming regulations of sources built, modified, or reconstructed before December 6, 2022, can expect similar standards to those found in NSPS OOOOb, but only after state laws have been created in line with the EP