19.11.2024
Continuous monitoring in light of the EPA’s OOOOb and Subpart W
Continuous methane emissions monitoring with Nubo Sphere equips oil and gas operators with year-round oversight of oil and gas assets, quick detection of fugitive methane emissions and actionable insights in support of LDAR activities. The EPA has introduced standards for using continuous monitoring aimed at reducing emissions without unduly increasing operators’ workloads. This article provides in-depth guidance to working with these regulations, focusing on work practices for continuous monito
- Industry Insights
- Oil & Gas

Table of contents
Executive summary
With the latest EPA regulations endorsing the use of approved advanced technologies for methane emissions monitoring, Sensirion Connected Solutions is preparing applications for EPA approval of Nubo Sphere as an advanced methane detection technology, both as a continuous monitoring solution and as a periodic screening technology. This article focuses on Nubo Sphere’s use as a continuous monitoring solution in line with EPA regulations.
If you would like to download the article as a printable PDF, please click here: Download
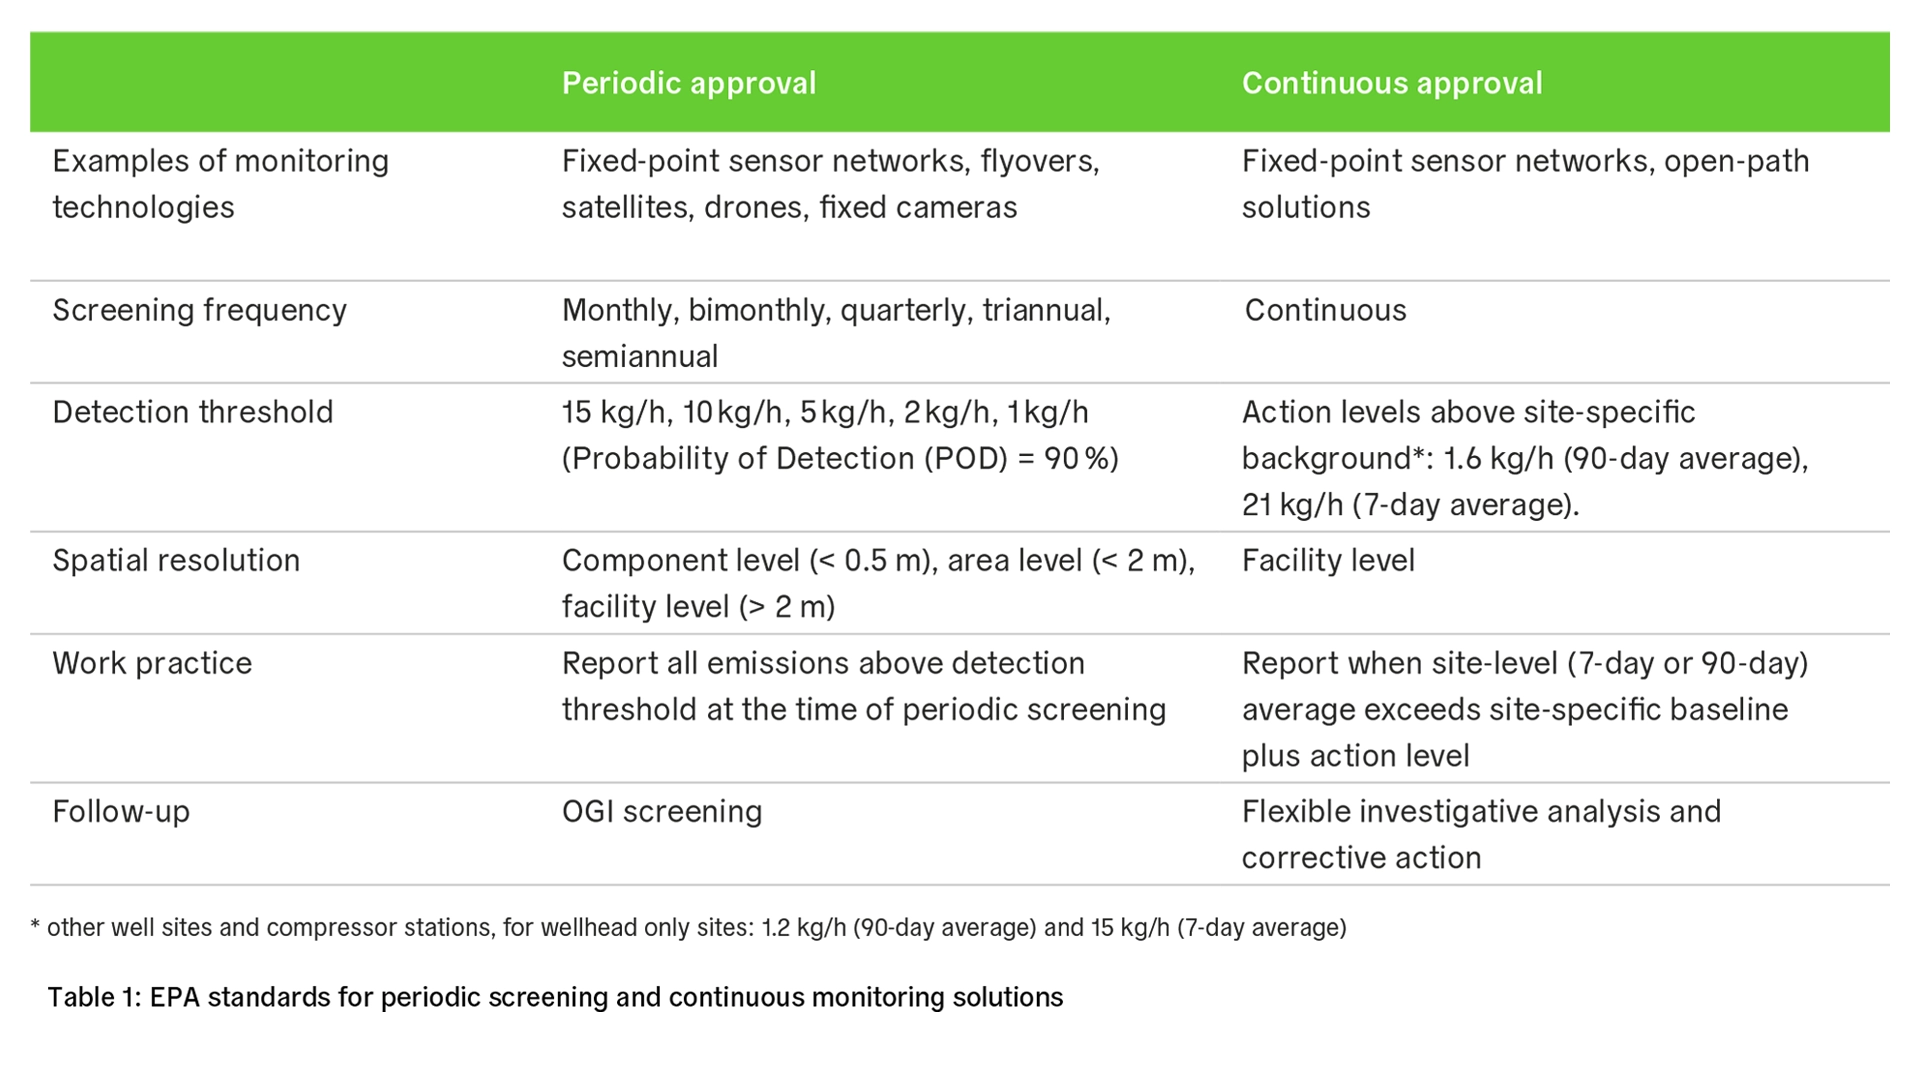
There are key differences between approval for continuous monitoring and periodic screening (see Table 1). To learn more about Nubo Sphere’s use for periodic screenings, see this article.
Continuous methane emissions monitoring with Nubo Sphere equips oil and gas operators with year-round oversight of oil and gas assets, quick detection of fugitive methane emissions and actionable insights in support of LDAR activities. The EPA has introduced standards for using continuous monitoring aimed at reducing emissions without unduly increasing operators’ workloads. At the heart of these standards, they have provided work practices based on calculating rolling averages of site-level emissions rates.
There’s a crucial implication for operators here: immediate follow-ups are not required. Follow-ups are only required if fugitive emissions are of a size or duration significant enough to exceed thresholds set by adding site-specific baselines to predetermined 7- or 90-day action levels.
This article provides in-depth guidance to working with these regulations, focusing on work practices for continuous monitoring as applied in compliance with NSPS OOOOb and GHGRP Subpart W. Operators interested in upcoming regulations of sources built, modified, or reconstructed before December 6, 2022, can expect similar standards to those found in NSPS OOOOb, but only after state laws have been created in line with the EPA's EG OOOOc. For more information on EG OOOOc or any part of the latest raft of EPA regulations on methane emissions from the energy sector, read this article.
How do EPA regulations in OOOOb and Subpart W concern continuous monitoring?
The EPA's latest regulations include two sections germane to continuous monitoring. First, OOOOb is a revision to the New Source Performance Standards (NSPS), in Part 60, regulating infrastructure built, modified, or reconstructed after December 6, 2022. It includes enhanced requirements for emissions monitoring, mandating more frequent monitoring across the board.
The EPA is encouraging the use of alternative technologies such as Nubo Sphere. This means that any approved continuous monitoring technology can be used by operators in lieu of monthly or bimonthly AVO surveys and quarterly or semiannual OGI or Method 21 inspections. Note that prior to receiving approval, continuous monitoring can already be used to qualify super emitter events and pre-empt third-party detection.
Second, the EPA has updated Part 98 (Mandatory Reporting of Greenhouse Gases) Subpart W regulating petroleum and natural gas systems. This update changes how operators report emissions that impact their Waste Emission Charge (WEC) obligations.
Using Nubo Sphere to reduce Waste Emissions Charges under GHGRP Subpart W
The EPA has amended Subpart W of the Mandatory Greenhouse Gas Reporting Program to improve the accuracy of emissions reports. This change will require operators to submit empirical emissions data, demonstrating whether, and to what extent, they must pay a Waste Emissions Charge.
The Mandatory Greenhouse Gas Reporting Program—applicable to the oil and gas industry under Subpart W—requires operators to report emissions from facilities, calculated and reported at the level of individual well-pad or gathering-and-boosting sites, and reported as aggregated to the basin level, that have emissions exceeding 25,000 metric tons of CO2e.
The WEC applies only to facilities reporting emissions above the 25,000 mt CO2e threshold and with calculated waste emissions above industry segment-specific thresholds for methane emissions intensity. In the natural gas production segment, for example, the methane intensity threshold would be 0.2 percent of gas sent to sales from a facility.
In terms of equipment leaks or fugitive emissions, Subpart W requires either direct measurement of emissions using flow meters, calibrated bags or high-volume samplers; periodic surveys using OGI or Method 21; or the use of population emission factors. Where periodic surveys are used, this rule assumes emissions durations based on the date of those periodic surveys in lieu of empirical information to the contrary. Emissions are then estimated using leaker emission factors, which may yield estimates of emissions larger than actual emissions, thus potentially driving WEC charges higher.
In contrast, where “other large emission events” are detected by the EPA, facilities or third parties approved through the NSPS OOOOb Super Emitter Program, the EPA has determined that continuous monitoring solutions such as Nubo Sphere are well-suited to detecting when anomalous emissions begin. They may, therefore, provide data on the duration of these “other large emission events”. Using data from Nubo Sphere to time-box large emission events limits operators’ reported emissions and, consequently, potential WEC obligations by several orders of magnitude.
Note, however, that the EPA has not approved any alternative technology for site-level quantification in support of Mandatory Greenhouse Gas Reporting, or for refining emissions factors. To complete emissions estimates for Subpart W reporting, operators will still need to complete a full site survey using Method 21 or OGI, as approved under Subpart W, even if emissions never exceed any action levels set out in NSPS OOOOb.
How to use continuous monitoring as prescribed by the EPA in NSPS OOOOb
NSPS OOOOb contains directions for creating and executing fugitive emissions monitoring plans. For operators executing periodic screenings, monitoring schedules are central to these plans. Continuous monitoring obviously doesn't work on a schedule. So, how does the EPA recommend operators use continuous monitoring solutions?
The EPA has stated that early adoption of advanced technologies for emissions monitoring is “critically important”. To this end, they are committed to streamlining work practices for operators who use continuous monitoring. Thus, continuous monitoring work practices include a key difference from traditional LDAR activities associated with periodic monitoring: rather than reacting to emissions as they are detected, operators are only required to act when the 7- or 90-day rolling average of site-level emission rates exceed the site-specific baseline and predetermined action levels. The EPA does not require same-day follow-up on single alerts from continuous monitoring solutions.
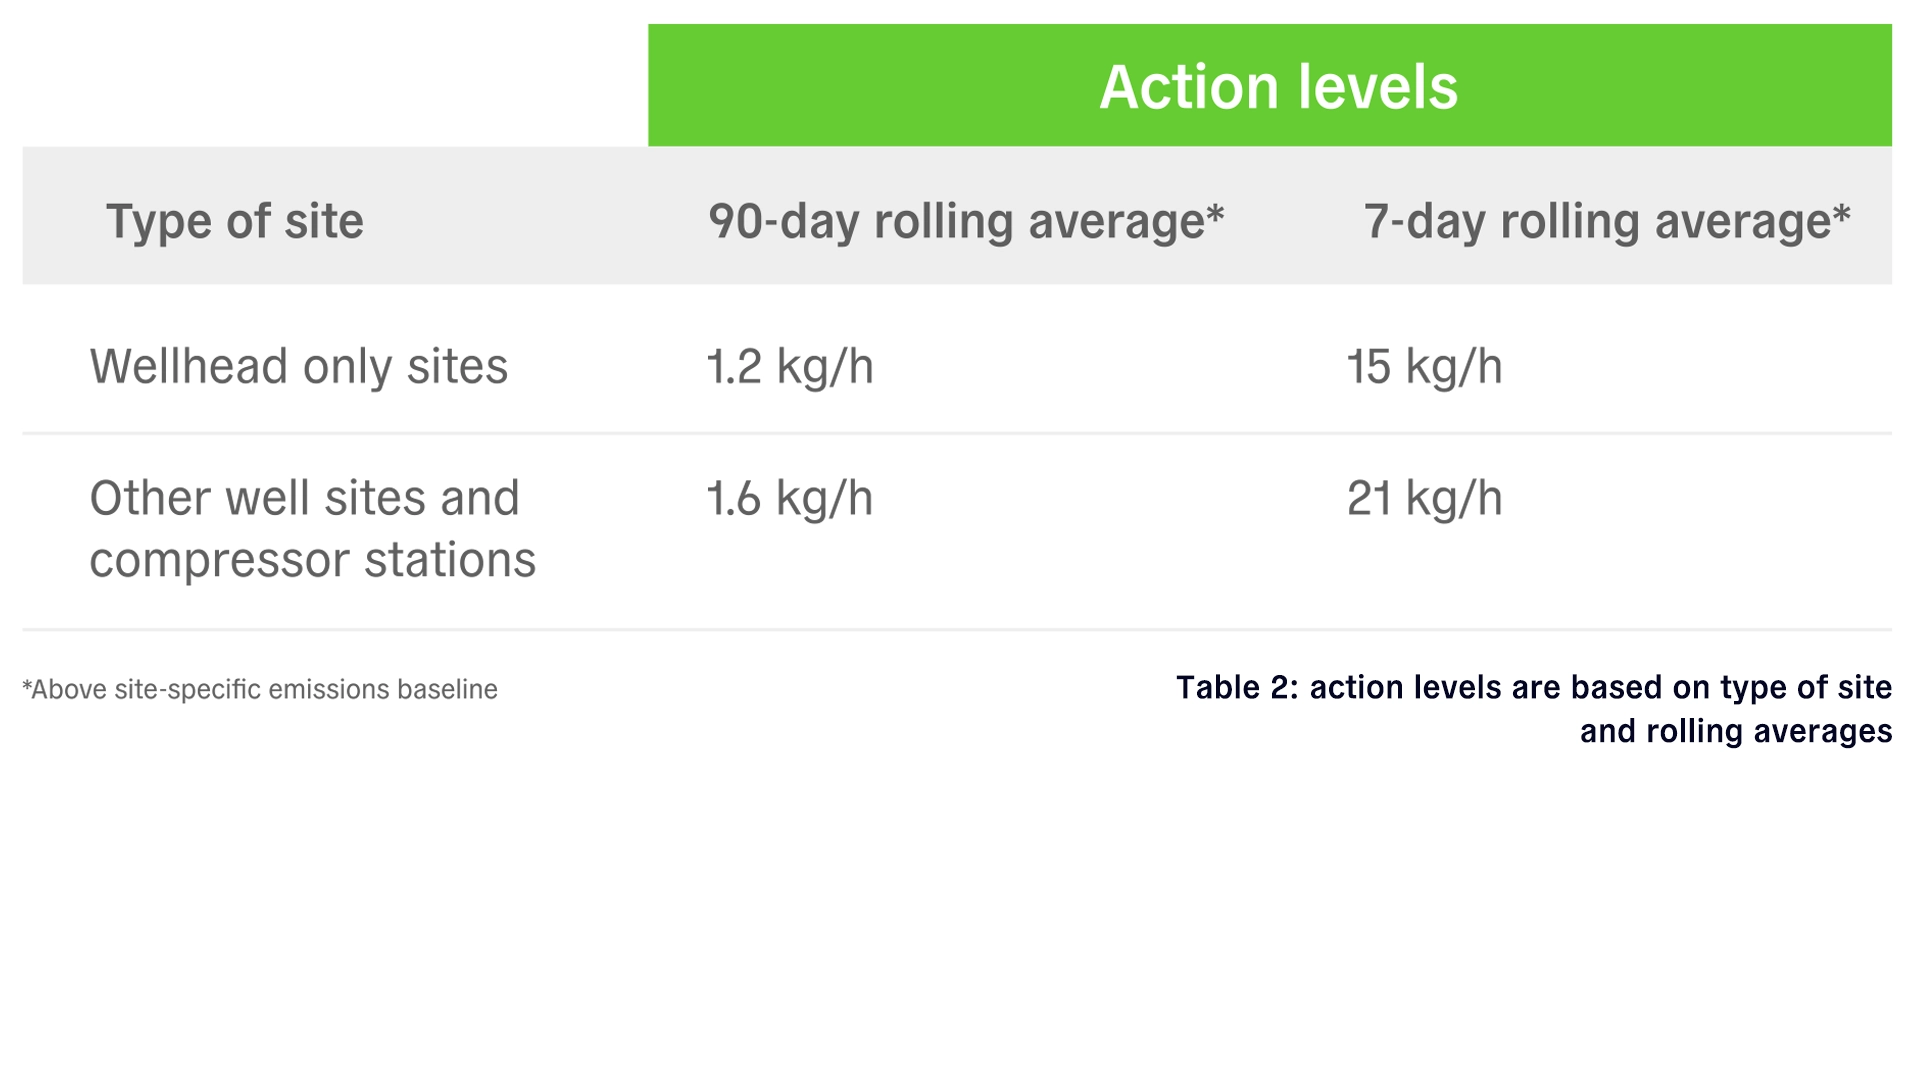
Rolling averages of emissions rates and site-specific emissions baselines are central to the EPA’s work practices for continuous monitoring. After ending any ongoing fugitive emissions, operators simply determine site-specific baselines and calculate both 7- and 90-day rolling averages of site-level emissions using information provided by their continuous monitoring solution. Comparing rolling averages to the baseline plus EPA-provided action levels (see Table 2) is enough to determine if any follow-up is required.
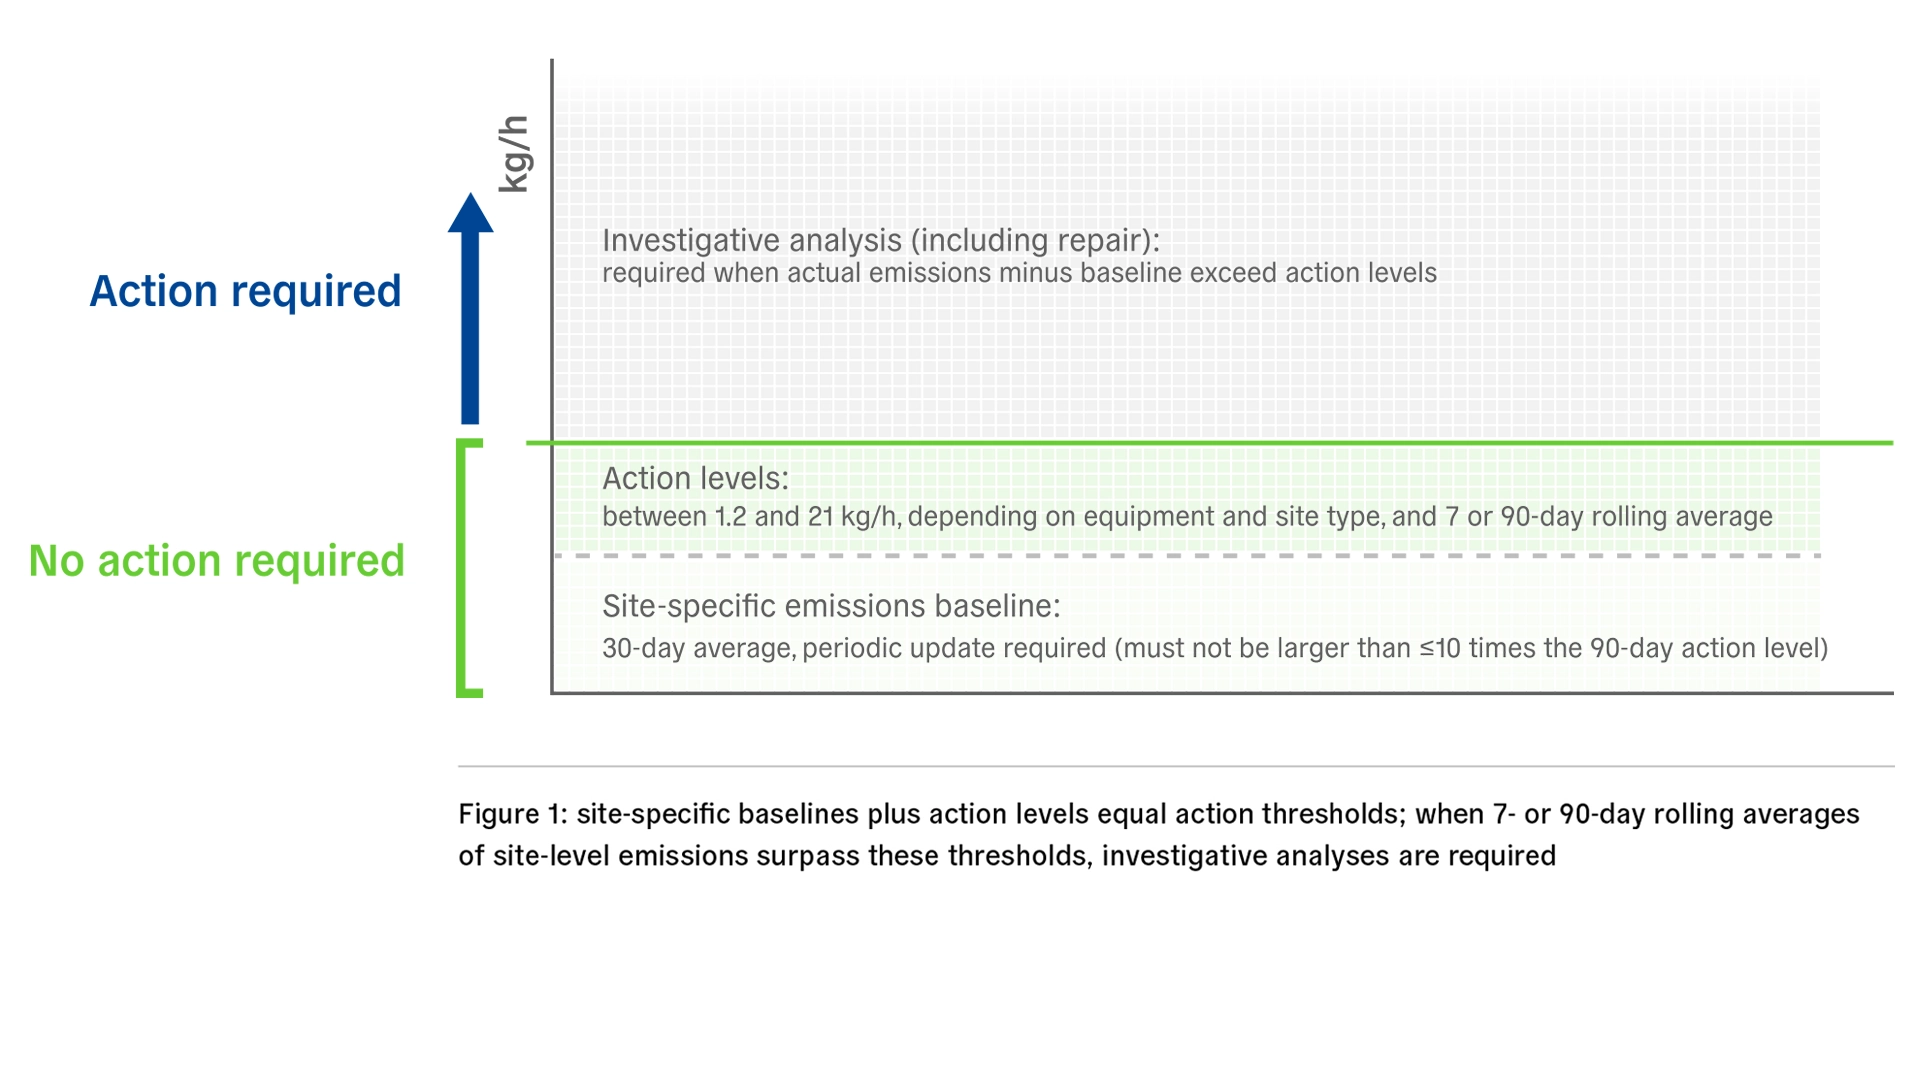
While Nubo Sphere continuously provides real-time leak detection and insights that operators can use to take quick and decisive LDAR action, the EPA expects operators to follow-up with an investigative analysis only if a rolling average of site-level emission rates exceed the sum of the site-specific baseline and action levels (see Figure 1). Exceedances may occur due to just one significant event, or several emissions of adequate rate or duration. See the section below, Continuous monitoring data from the field, for commentary on applying the EPA’s continuous monitoring work practices to real-world examples.
Otherwise, NSPS OOOOb retains elements of NSPS OOOOa: operators will still create and submit monitoring plans, monitor for emissions, repair leaks and report compliance information annually.
Work practices for using an EPA approved continuous monitoring solution:
- Develop a monitoring plan
Plans must include the number of devices as well as procedures for managing downtime, identifying and repairing emitting infrastructure, and record keeping.
- Install Nubo Sphere
Operators have 120 days after startup of new or modified infrastructure or until the next scheduled screening to commence monitoring
- Determine a site-specific baseline
Eliminate all fugitive emissions and, over the following 30 days, find each site's baseline emission level
Baselines must be lower than 12 kg/h or 16 kg/h depending on the type of the site (see Table 2)
- Determine the applicable action level for the site
Action levels depend on the type of site and differ for the 7- or 90-day site-level emission rate average (see Table 2).
- Calculate 7- and 90-day rolling average site-level emission rates
See this article for more details on calculating rolling averages.
Acting on emissions: from baselines to action levels
When do operators need to act on emissions to achieve EPA compliance? It’s simple: when rolling averages of emissions exceed the sum of baseline emissions and predetermined action levels. Based on the type of site and 7- or 90-day rolling averages, this will be one of four numbers. See Figure 1 for a visualization.
Action levels are time-weighted averages that trigger investigative analyses to identify the causes of exceedances. They correspond to different kinds of leaks. Exceeding the 7-day action level alerts operators of large, short-term peaks in emissions above the expected baseline during normal operation. Exceeding the 90-day action level, on the other hand, reveals slower, longer-term increases of undetected, likely small emissions events.
The upshot is that operators aren't required to follow up on small or expected emissions. It's only necessary to act on emissions significant enough—or significantly accumulated enough—to shift rolling averages beyond action levels.
Furthermore, operators are free to choose how to act. They may, for example, conduct an OGI survey, or look at the operational data of their SCADA system and determine the root cause of an emission. Nubo Sphere can also support follow-up by localizing emissions to their equipment group. The EPA leaves operators a great degree of flexibility in deciding how they approach follow-up for action level exceedances.
This is different from requirements for operators using periodic screenings. When using periodic screening, any detected emissions above set detection levels require follow-up OGI or Method 21 surveys, regardless of the nature or size of the emission.
For more information on what the EPA expects from follow-up investigative analyses, see this article.
Continuous monitoring data from the field
Nubo Sphere has been at work in the field, providing real-world examples to analyze considering the EPA’s continuous monitoring work practice. Drawn from Permian upstream, Appalachian midstream and Barnett upstream sites, these examples show site emission profiles with a temporal resolution of 15 minutes (see Figure 2).
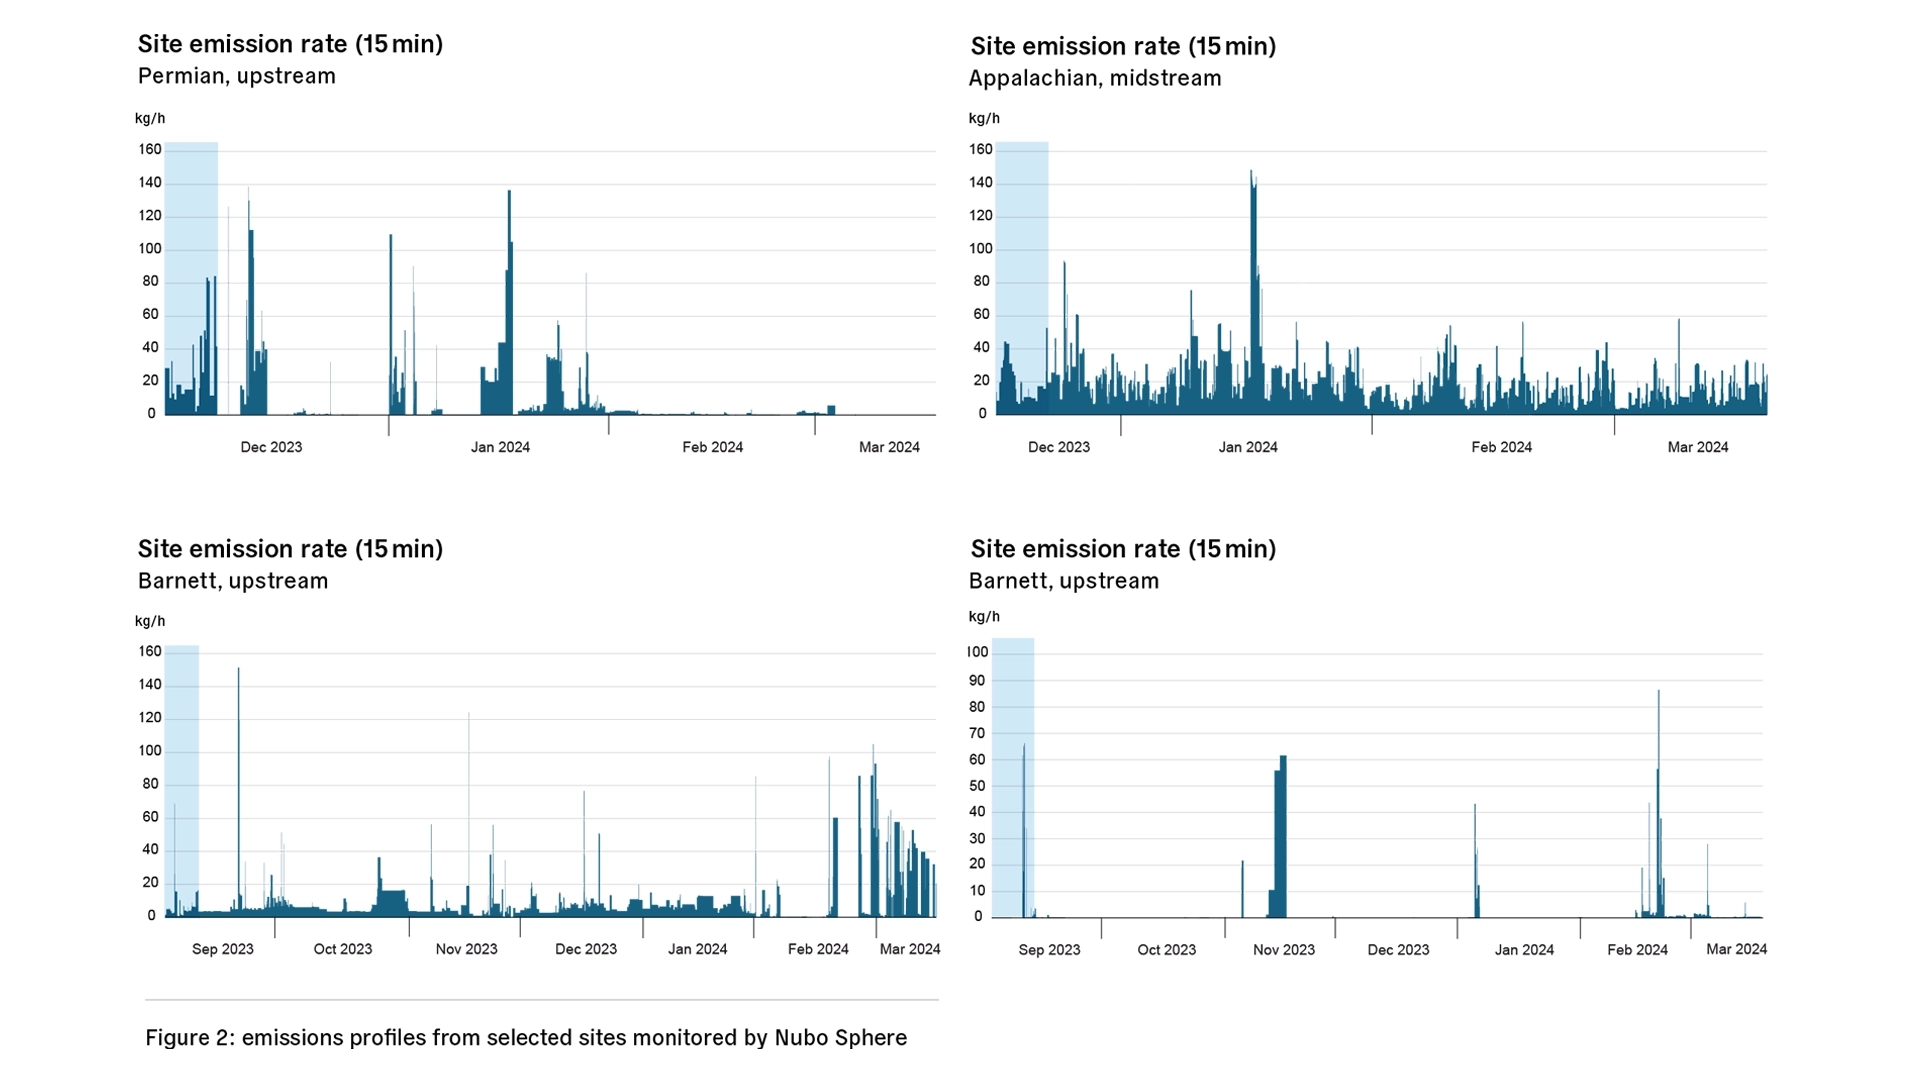
The Permian upstream site is an example of a typical upstream site. Some emissions are large, even exceeding the super emitter threshold of 100 kg/h, but site-level emissions routinely drop to a low level.
The Appalachian midstream site is busier. Processes at midstream sites, such as venting, typically produce more ongoing emissions, reflected in this site-emissions profile's differences from the upstream sites.
There are two Barnett upstream sites. On the left is a typical upstream site, comparable to the Permian upstream site. On the right is a “clean site” with low to no background emissions. Given the low level of emissions and few fugitive emissions, emission events stand out and should provoke action even when averaging over seven or 90 days.
Note that on all sites, a 30-day baseline was determined retrospectively without operators preparing sites specifically by, for example, reducing fugitive emissions or delaying scheduled maintenance activities, as required by the EPA. 30-day baselines may, therefore, include ongoing fugitive emissions and may not reflect 30-day baselines on sites monitored under EPA work practices. Following EPA work practices may yield a different number of exceedances and required follow-ups.
Evaluating the emissions profiles
Analyzing the above emissions profiles using 7-day rolling averages, it's possible to see when EPA work practices would mandate follow-ups. See Figure 3 for an illustration of when 7-day rolling average emissions exceeded thresholds on each site.
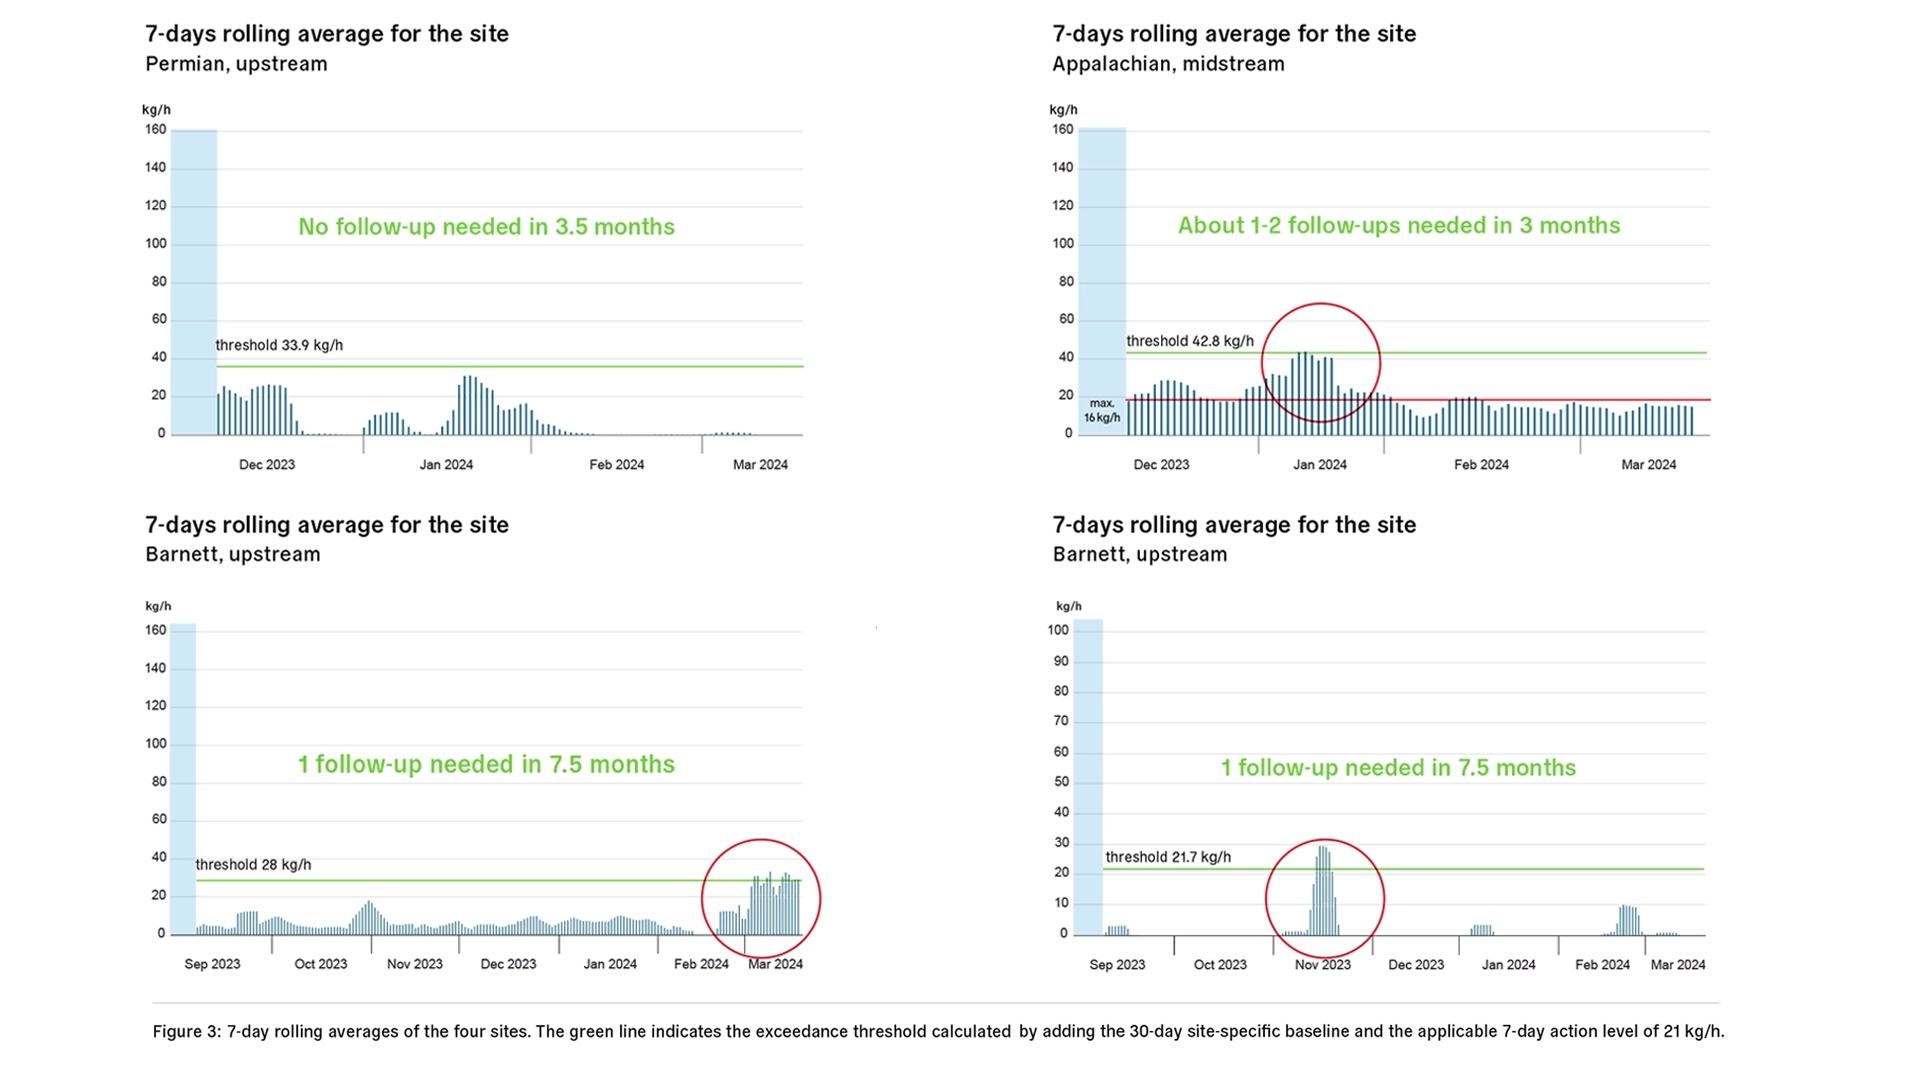
The Barnett upstream sites are notable in this analysis. First, the typical upstream site experienced large emission early in this monitoring period. These emissions were large enough to surpass the super emitter threshold, but short enough to limit their impact on the site's 7-day rolling average. In contrast, later in the monitoring period, a sustained period of smaller emissions pushed the 7-day average beyond the exceedance threshold.
Meanwhile, the "clean” Barnett upstream site, with a low baseline and infrequent emissions, presents a case for responding to every alert. But only the large emission in the middle of the monitored period lasted long enough to exceed the 7-day threshold—and even exceeded the 90-day threshold.
Conclusion: the EPA's work practices for continuous monitoring make Nubo Sphere an easy choice
By allowing the use of advanced technologies for continuous emissions monitoring, the EPA has paved the way for easy compliance with stronger regulations. Operators who rely on periodic OGI or AVO screening can replace those screening obligations with continuous monitoring—without taking on more follow-up obligations.
Nubo Sphere is an asset for operators aiming to detect and reduce emissions. Used in support of LDAR programs, it delivers quick detection and localization of fugitive emissions. In the case of large-release events subject to third-party super-emitter reporting, this can make the difference that prevents heavy Waste Emissions Charges and negative publicity.
With the latest EPA regulations found in Subpart W and NSPS OOOOb, this remains important. Under Subpart W, Nubo Sphere can time-box emissions, furnishing reports with accurate start and end times, helping operators to manage and reduce potential Waste Emissions Charges.
In summary, continuous monitoring with Nubo Sphere should allow operators to:
- Meet EPA regulations and replace regular OGI or AVO site screenings.
- Limit follow-up investigations to only those cases where site-averaged emissions exceed site-specific baselines plus action levels.
- Save on potential WEC penalties by identifying large emissions early and precisely time-boxing reported emissions.
- Avoid reputational damage by preempting third-party detection of super emitter events and subsequent publication on the EPA’s site.
- Reduce emissions to meet ESG goals and cultivate trust with stakeholders and the community.
The EPA has created a clear pathway for the use of continuous monitoring. But they have also provided standards for using advanced technology such as Nubo Sphere for periodic screenings, in place of many OGI or AVO screenings. That’s why Sensirion Connected Solutions has also submitted Nubo Sphere for approval as alternative technology for periodic screening. See this article to learn more about using Nubo Sphere as a periodic screening technology.

Related Insights Blog
09.05.2025
Proactive compliance with California’s Senate Bill 1137
The California Senate Bill 1137 (SB 1137) applies to oil and gas operations located in defined health protection zones within the state. Read on to learn how this bill will affect operations, and how Nubo Sphere can help achieve ompliance—not only with respect to SB 1137 but also California’s developing methane regulations in line with the US EPA’s EG OOOOc.
19.11.2024
How to use continuous monitoring for periodic screening: why Nubo Sphere is seeking EPA approval as a periodic screening solution
This article explores the advantages of continuous monitoring when used for periodic screenings. It includes guidance on the latest EPA regulations found in NSPS OOOOb and GHGRP Subpart W with an eye to efficiently reducing emissions through periodic screenings. Operators interested in upcoming regulations of sources built, modified, or reconstructed before December 6, 2022, can expect similar standards to those found in NSPS OOOOb, but only after state laws have been created in line with the EP
15.05.2024
Clearing the air: how continuous monitoring supports compliance with the latest EU methane regulations
In April, the European Parliament reached a preliminary agreement with EU member states on legislation to reduce methane emissions from the energy sector. Find out what you need to know to ensure compliance and maintain operational excellence, especially when using continuous monitoring solutions such as Nubo Sphere.